
Fig. 2.
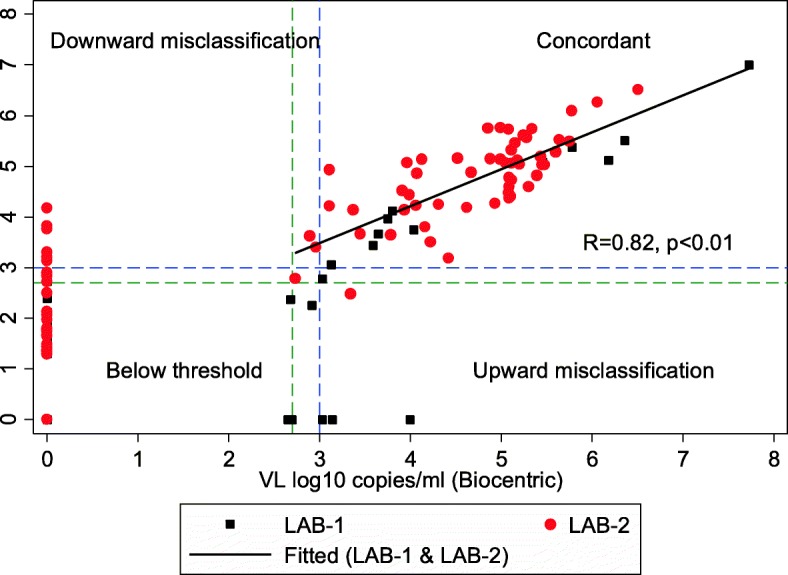
Assay correlation and concordance between the Biocentric platform and the reference method. VL, viral load; R, Pearson’s correlation coefficient; p, p-value; LAB-1, laboratory 1 in Nhlangano; LAB-2, laboratory 2 in Mbabane. The correlation graph shows paired VL values obtained from the reference and Biocentric platforms. The Pearson’s correlation coefficient and the fitted linear regression line were calculated for quantifiable VL values above the threshold level of 2.62 log10 copies/mL on both methods (n = 66)