Fig. 1.

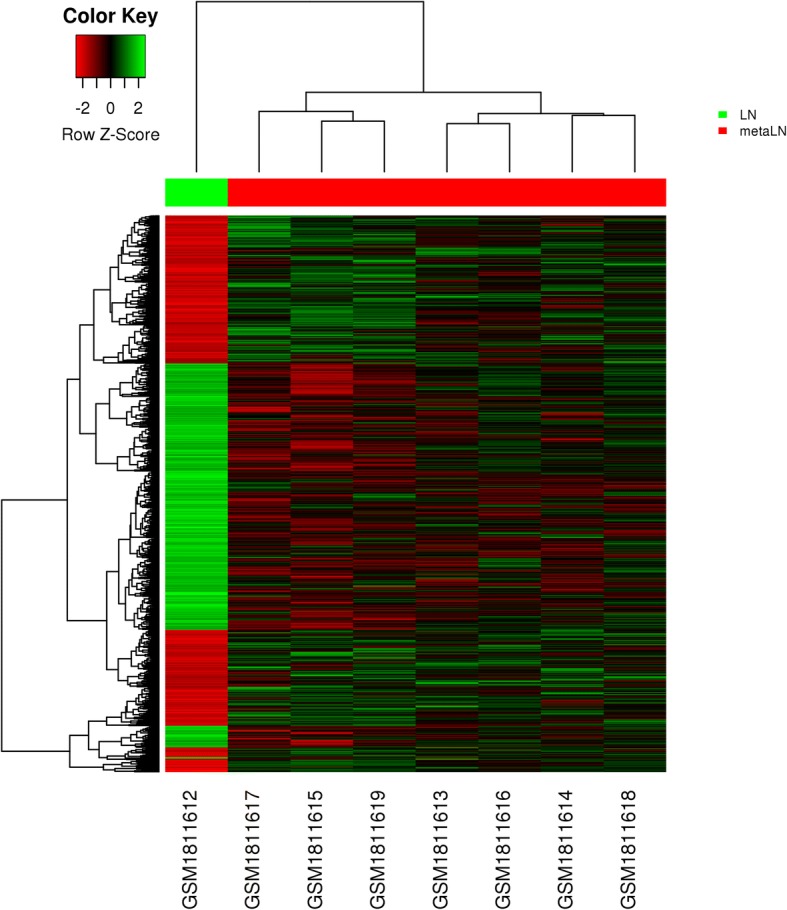
Heat map of distribution of DEGs in GSE70604. The comparisons of gene expression profiles were made between lymph nodes with metastasis of oral squamous cell carcinoma (OSCC) and normal lymph nodes

Heat map of distribution of DEGs in GSE70604. The comparisons of gene expression profiles were made between lymph nodes with metastasis of oral squamous cell carcinoma (OSCC) and normal lymph nodes