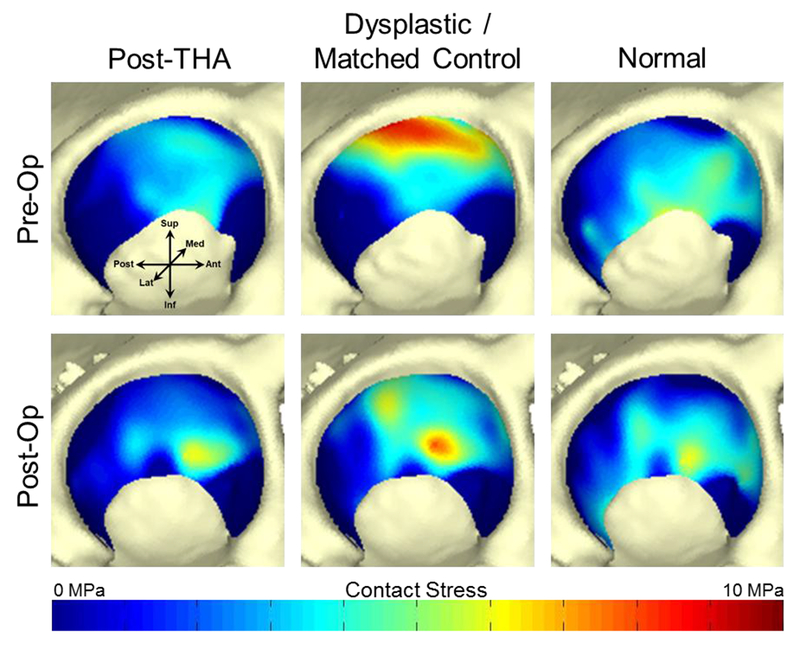
Figure 5.

Pre- and post-operative contact stress distributions calculated using all four gait patterns in a single dysplastic patient. Dark blue color indicates no contact between the acetabular and femoral cartilage surfaces at that location. Loading this patient’s DEA models with the dysplastic and matched control gait patterns resulted in decreased and medialized maximum contact stress after PAO, indicating improved joint mechanics that were not appreciated in models loaded with the post-THA or normal gait patterns.
