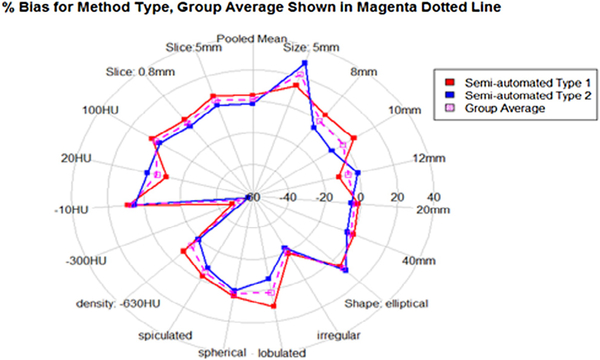
Figure 4.
Pivotal: For semi-automated type 1 (no post-segmentation correction allowed) and semi-automated type 2 (post-segmentation correction allowed) algorithms, the %bias is shown with solid-lined polygons for various nodule and imaging characteristics. The mean %bias of all groups by nodule characteristic is shown by the magenta dotted polygon.

