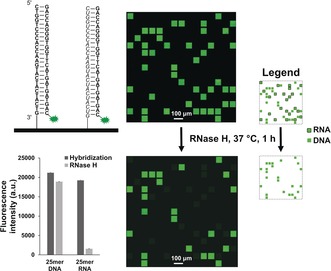
Figure 2.

Schematic representation of DNA (bold) and RNA (italic) sequences hybridized to the Cy3‐labelled DNA complement. A small scan excerpt (ca. 5 % total synthesis area) of the hybridized array is shown to the right. Dark gaps between features only contain a linker (T10). Spot size is approximately 70×70 μm. The same array is scanned after treatment with RNase H (5 U) for 1 h at 37 °C. The legend on the right identifies the RNA and DNA features in the scanned array. The fluorescence intensities (arbitrary units) are then plotted before and after RNase H treatment. Error bars are standard error of the mean (SEM).
