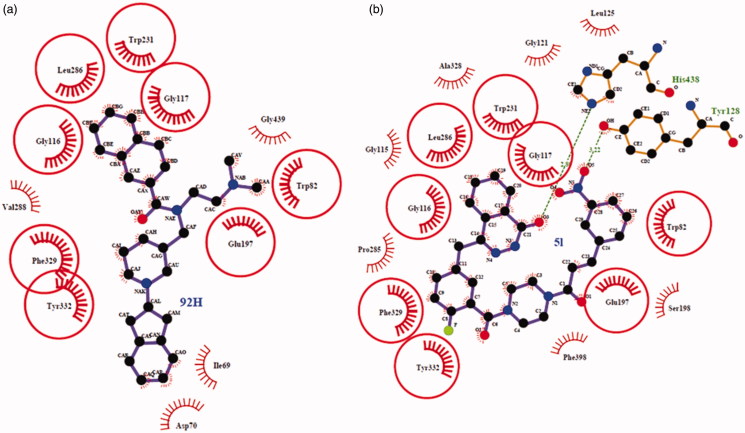
Figure 4.
Ligplot image showing the interactions of the 92H (a) and 5l (b) with the enzyme huBChE. Arcs with red lines represented amino acid hydrophobic contacts; green dashed lines represents hydrogen bonds. The commonly interacting amino acid residues in both interactions were encircled in red circles.

