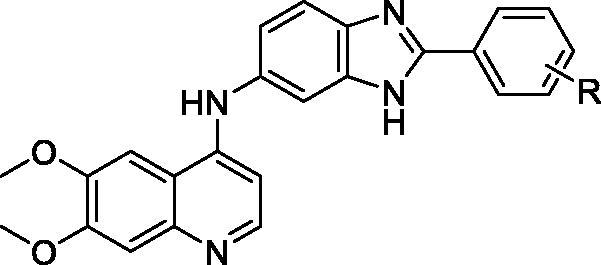
Table 1.
Chemical structures of target compounds and their c-Met inhibitory activities in vitro. 
| Compound | R | c-Met inhibition |
|
|---|---|---|---|
| % Inhibition (10 μΜ)a | IC50 (μM)a | ||
| 12a | 2-F | 16.9 ± 3.5 | N.D.b |
| 12b | 3-F | 62.8 ± 1.2 | 1.2 ± 0.4 |
| 12c | 4-F | 89.2 ± 0.3 | 0.11 ± 0.02 |
| 12d | 2-Cl | 17.4 ± 3.7 | N.D. |
| 12e | 3-Cl | 54.5 ± 6.9 | 4.8 ± 0.5 |
| 12f | 4-Cl | 63.8 ± 0.7 | 0.93 ± 0.10 |
| 12g | 4-Br | 54.2 ± 0.1 | 5.5 ± 0.9 |
| 12h | 2-I | 21.6 ± 2.5 | N.D. |
| 12i | 3-I | 66.0 ± 0.8 | 0.54 ± 0.13 |
| 12j | 2-CH3 | 23.0 ± 0.4 | N.D. |
| 12k | 3-CH3 | 52.7 ± 1.6 | 8.5 ± 2.0 |
| 12l | 4-CH3 | 69.0 ± 1.2 | 0.32 ± 0.07 |
| 12m | 4-CH2CH3 | 95.0 ± 0.3 | 0.056 ± 0.012 |
| 12n | 4-C(CH3)3 | 97.1 ± 3.5 | 0.030 ± 0.008 |
| 12o | 2-OCH3 | 24.2 ± 0.1 | N.D. |
| 12p | 2,6-di-F | 25.9 ± 1.5 | N.D. |
| 12q | 2,6-di-Cl | 37.0 ± 4.0 | N.D. |
| 12r | 3,4-di-Cl | 55.4 ± 2.9 | 5.3 ± 1.6 |
| 12s | 2-Br-5-F | 23.0 ± 1.1 | N.D. |
| cabozantinibc | N.D. | 0.0045 ± 0.0006 | |
n = 3 (mean ± SD).
N.D.: not determined.
Used as a positive control.
