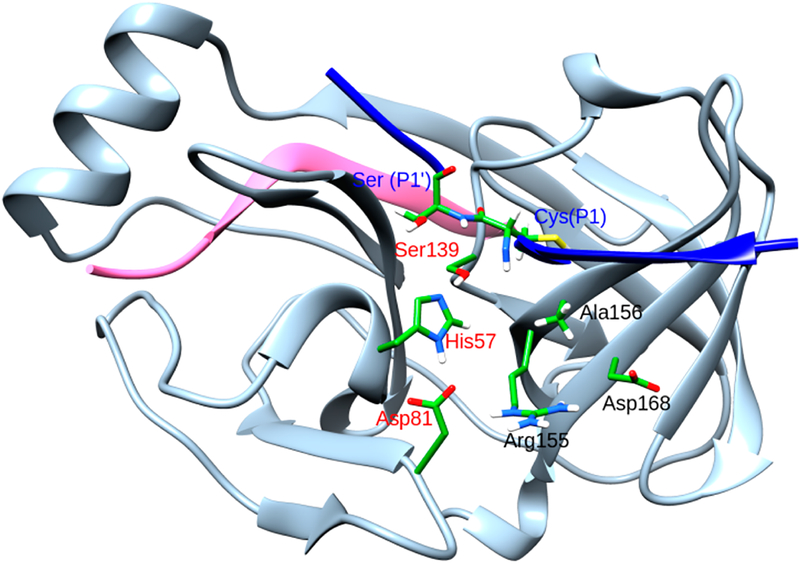
Figure 1.
Crystal structure of NS3/4A protease. The 4A cofactor is shown in pink, the P6P4′ substrate in blue, and NS3 in gray. The catalytic residues are shown in red whereas the substrate residues at the peptide cleavage site are shown in blue. Important mutations that confer resistance to drugs are shown in black.

