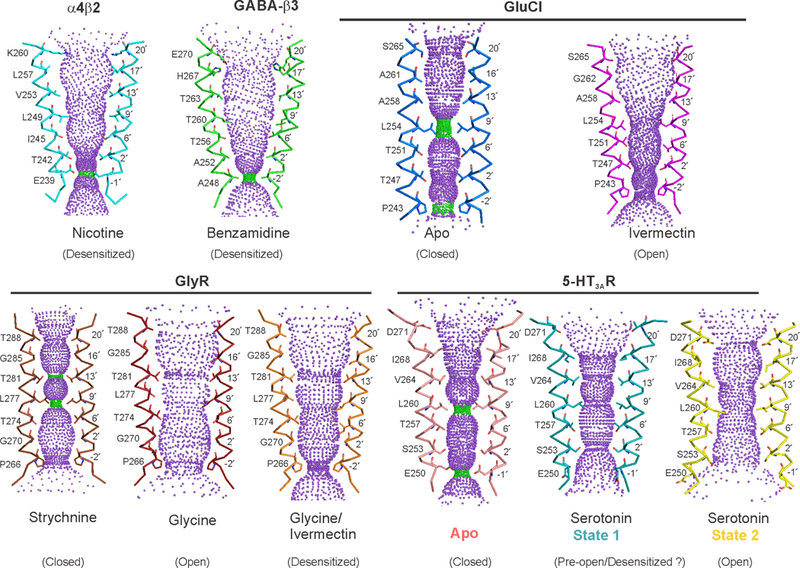
Extended Data Figure 9. Comparison of pLGIC pore profiles.

Pore profiles calculated using the HOLE program46 for the M2 region of nAChR (PDB ID: 5KXI)4, β3-GABA receptor (PDB ID: 4COF)7, GluCl (Apo- PDB ID: 4TNV59 and ivermectin-bound- PDB ID: 3RHW60), GlyR (strychnine-bound- PDB ID: 3JAD, glycine-bound- PDB ID: 3JAE, and glycine/ivermectin-bound- PDB ID: 3JAF)5 and 5-HT3AR (Apo- PDB ID: 6BE111, State 1- PDB ID: 6DG7, and State 2- PDB ID: 6DG8). Only two M2 helices are shown as ribbon for clarity. Pore facing residues are shown as stick representation. Green and magenta spheres define radii of 1.8–3.3 Å and > 3.3 Å, respectively.
