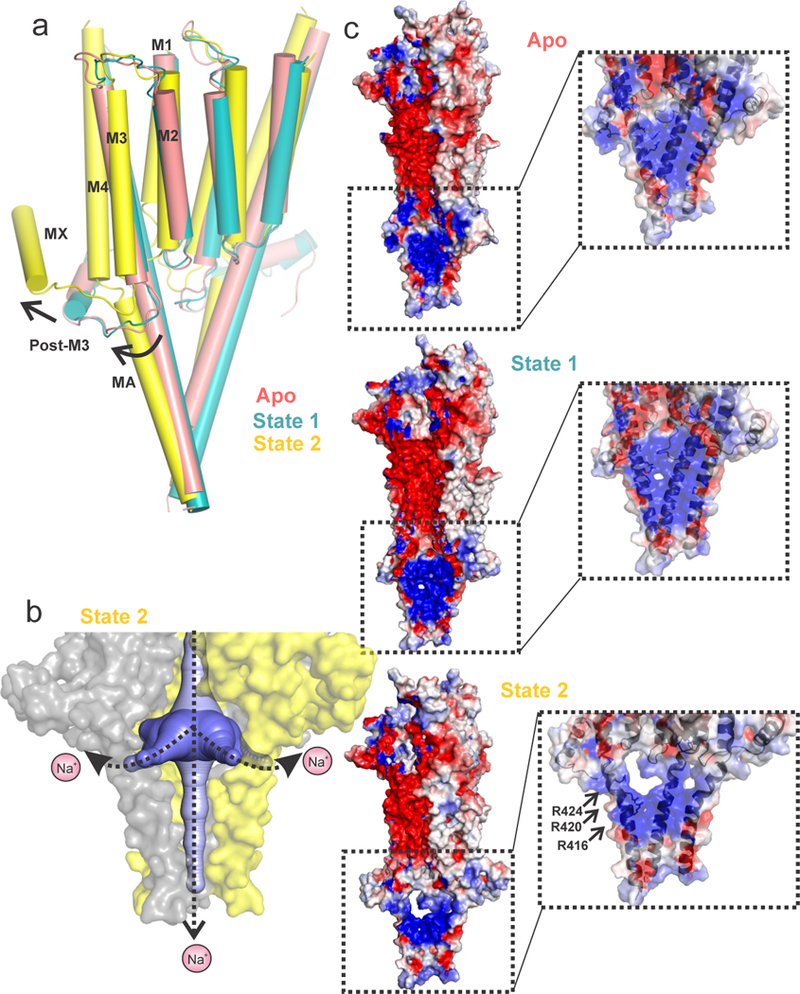
Figure 3. Opening of the lateral portal for ion exit.

a, An alignment of Apo, State 1 and State 2 structures. The TMD and ICD are shown for two adjacent subunits. The arrows show the direction of relative movements of the helices. b, The solvent-accessible vestibule in the ICD of State 2 was calculated with a minimum cavity radius of 2.8 Å. One of the subunits in the surface representation is removed for clarity. The plausible ion exit pathways are indicated by dotted arrows. c, The solvent-accessible electrostatic potential map generated using the APBS tool. The inset shows a zoomed-in view of the ICD to highlight the progressive opening of the lateral portal from the Apo structure to State 2. Residues Arg416, Arg420, and Arg424 (shown in stick representation) are implicated in regulating the single channel conductance of 5-HT3AR.
