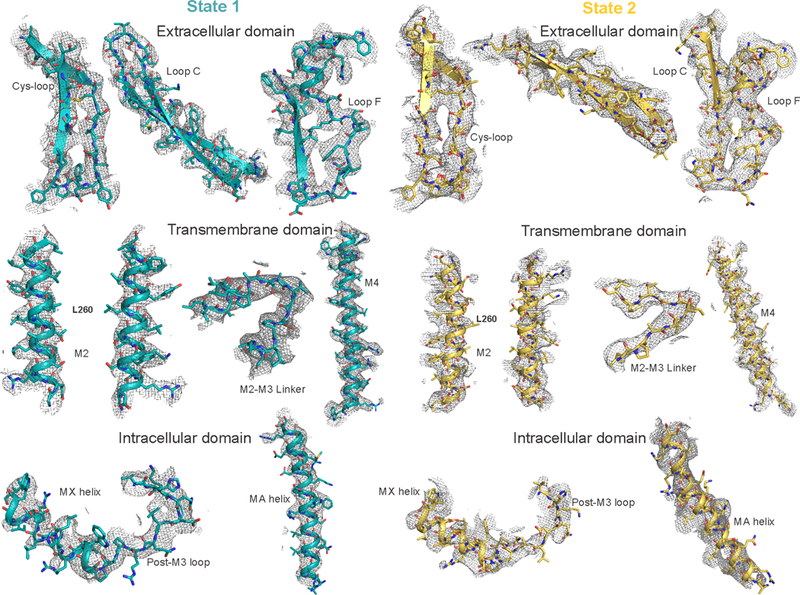
Extended Data Figure 3. Map correlation of State 1 and State 2.

Various regions of the model (shown as a cartoon) and corresponding density map (mesh) around the residues are shown to validate the final model. Residues are depicted as sticks. The depicted regions in State 1 and the corresponding contour levels: Cys-loop (7.0σ), Loop C (8.0σ), Loop F (8.0σ), M2 (6.0σ), M2-M3 linker (7.0σ), M4 (6.5σ), MX helix (7.5σ) and MA helix (7.5σ). The depicted regions in State 2 and the corresponding contour levels: Cys-loop (8.5σ), Loop C (8.0σ), Loop F (8.0σ), M2 (6.0σ), M2-M3 linker (7.0σ), M4 (7.0σ), MX helix (7.0σ) and MA helix (6.0σ).
