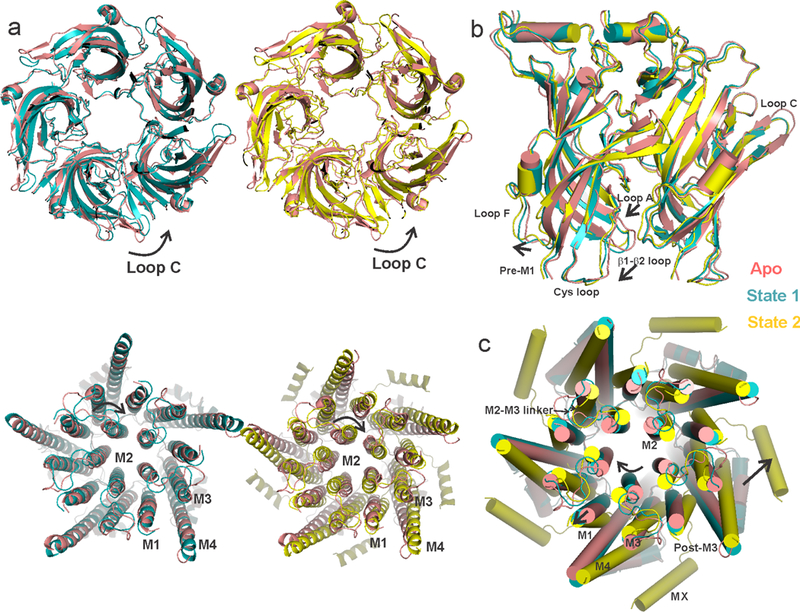
Extended Data Figure 4. Serotonin-induced conformational changes in the ECD and TMD.

a, A global alignment of the Apo structure with State 1 (left) and State 2 (right). The top panel shows the ECD and the bottom panel shows the TMD, both viewed from the extracellular end. The arrows indicate the direction of rotation with respect to the Apo state. State 1 and State 2 structures superimpose with Apo-ECD with an RMSD of 1.16 for State 1 and 1.41 for State 2 (residues 8–220). State 1, and particularly State 2, diverge significantly in the TMD and ICD (RMSD of 1.1 for State 1 and 4.24 for State 2 for residues 221–462). b, A side-view of the ECDs upon aligning State 1 and State 2 to the Apo state. c, A top view of the TMDs when aligned with respect to the ECD. The arrows show relative displacements in different regions of State 1 and State 2 with respect to Apo.
