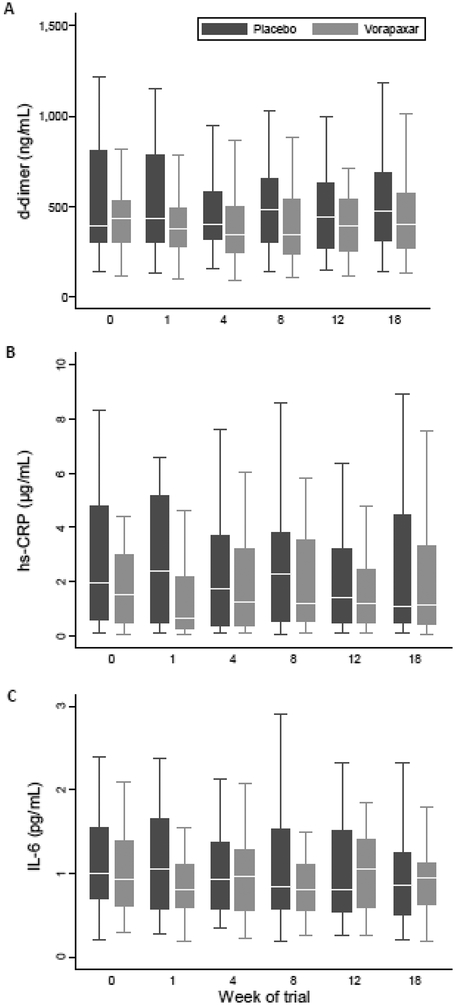
Figure 2. d-dimer, hs-CRP and IL-6 levels during the trial.
Box and whiskers plots show median (line), interquartile range (box) and whiskers (defined as UQ+1·5xIQR and LQ-1·5xIQR) for the two groups (vorapaxar grey, placebo black boxes) during the trial. Potential outliers are not shown. Vorapaxar or placebo was given for weeks 0–12 and then stopped. A. Plasma d-dimer (ng/mL), B. Plasma hs-CRP (μg/mL), C. plasma IL-6 (pg/mL).

