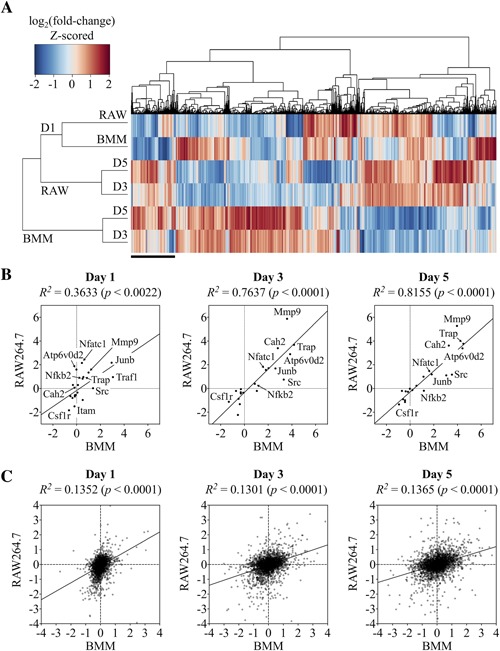
Figure 2.

Unsupervised hierarchical clustering and correlation analysis reveals major differences in the proteomes of BMMs and RAW264.7 cells. (A) Protein expression changes in BMMs and RAW264.7 cells differentiated using M‐CSF and RANKL for 1, 3, or 5 days. Heat map of all identified proteins (n = 3148) analyzed by hierarchical clustering analysis. (B) Pearson correlation analysis of OC differentiation marker protein expression (n = 20) in RAW264.7‐ and BMM‐derived osteoclasts show a strong positive correlation between the two cell models. (C) The same analysis applied to the entire data set (n = 3148), however, revealed a relatively poor correlation (R2 ≈ 1.3). Expression values are log2‐transformed ratios relative to day 0.
