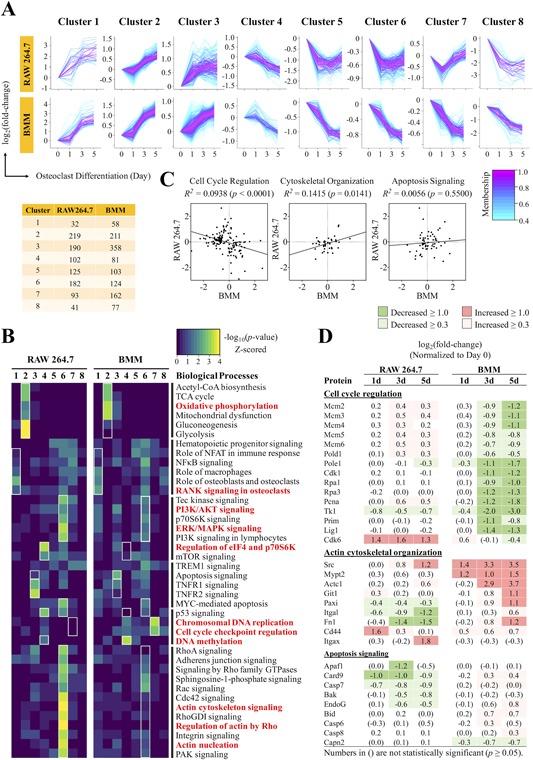
Figure 3.

Comparative analysis of temporal expression profiles identified diverse biological processes significantly different between RAW 264.7 cells and BMMs. (A) Fuzzy c‐means clustering of significantly altered proteins to determine the temporal patterns that characterize the OC proteome. Membership scores indicate the degree to which proteins belong in each cluster. The number of proteins belonging to each cluster is indicated in the table below. (B) Gene ontology term analysis for biological processes that represent the proteins in each fuzzy c‐means cluster. Red bolded terms indicate biological processes that were strongly enriched and/or strongly contrasted between RAW 264.7 cells and BMMs. (C) Pearson correlation analysis applied to proteins involved in cell cycle signaling, cytoskeletal organization, and apoptosis signaling at day 5 of OC differentiation. (D) Table of key proteins found to be poorly or negatively correlated between RAW 264.7 cells and BMMs.
