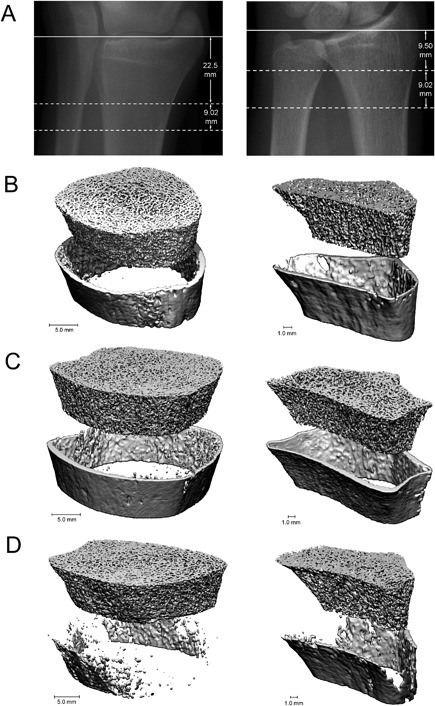
Figure 2.

HR‐pQCT provides detailed images of bone microarchitecture at the radius (left) and tibia (right). Scout view (A) reference line position (solid line) and the measurement site (dotted line). Images from healthy, postmenopausal white female (B). Images from female with CKD, no fractures (C). Images from female with CKD and prevalent fractures (D). Reprinted with permission from Nickolas et al.103
