Figure 3.

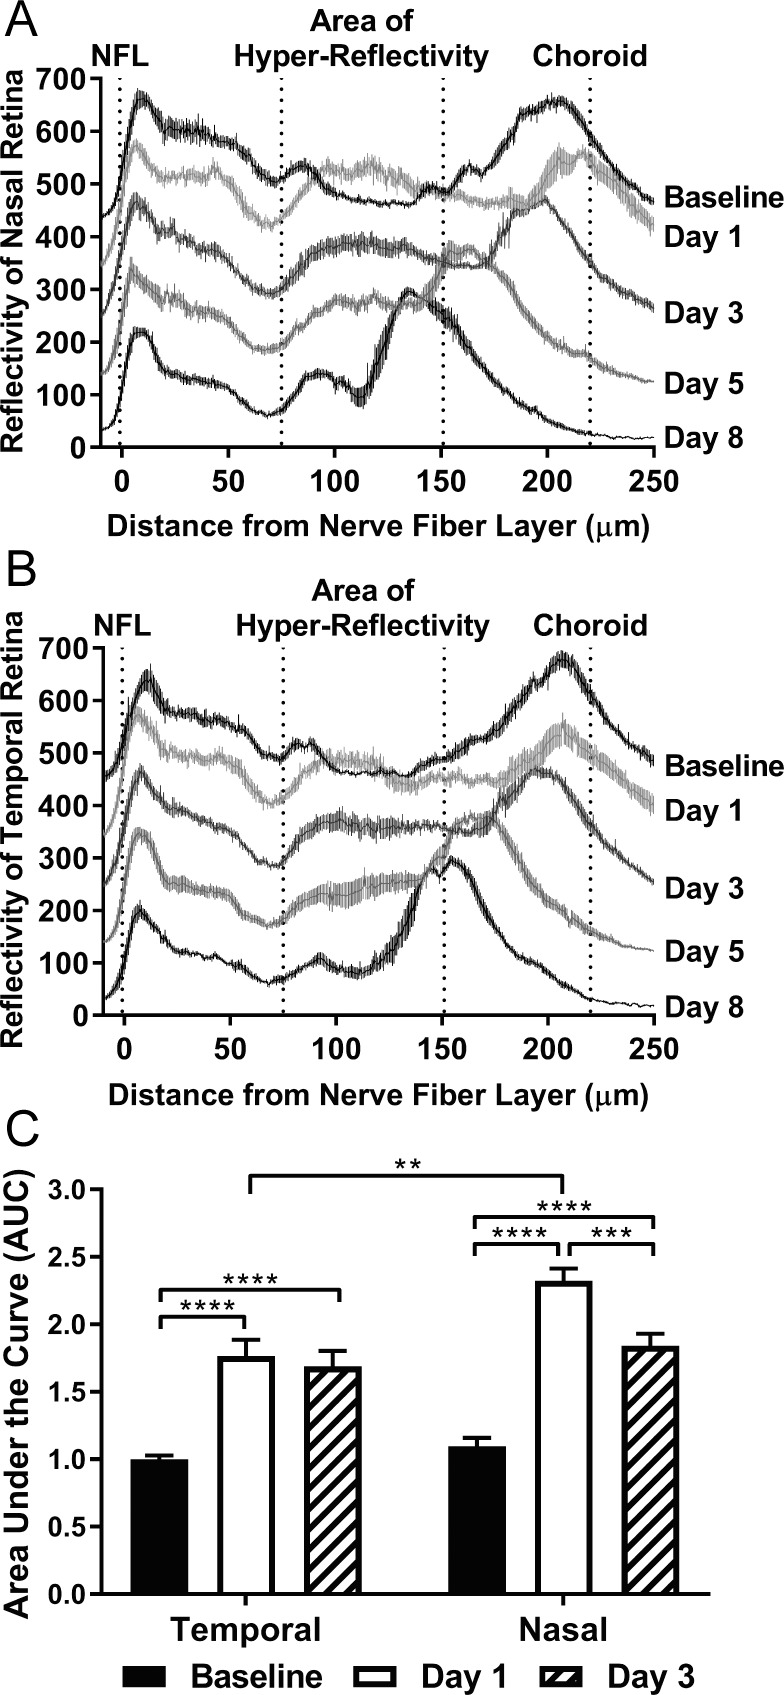
SD-OCT associated hyper-reflectivity is asymmetric and peaks one day after light damage. Longitudinal reflectivity profiles for n = 8 mice were generated and combined to create composite curves describing the (A) nasal and (B) temporal retina for the baseline, as well as days 1, 3, 5, and 8 post-light damage time points. Composite curves are represented as the mean reflectivity ± SEM at a given position along the retina. The curves corresponding to each time point are offset by 100 units on the Y-axis so that the differences in deflection can be appreciated between time points. The area of hyper-reflectivity is marked as spanning approximately from the INL to subretinal space. (C) The area under the curve (AUC) was measured within the area of hyper-reflectivity in individual reflectivity plots of the temporal or nasal retina for the baseline, as well as day 1 and day 3 post-light damage time points. The bar graph represents the mean AUC ± SEM (n = 8 per time point). Two-way ANOVA followed by multiple comparisons tests was utilized to determine statistical significance. **P < 0.01; ***P < 0.001; ****P < 0.0001.
