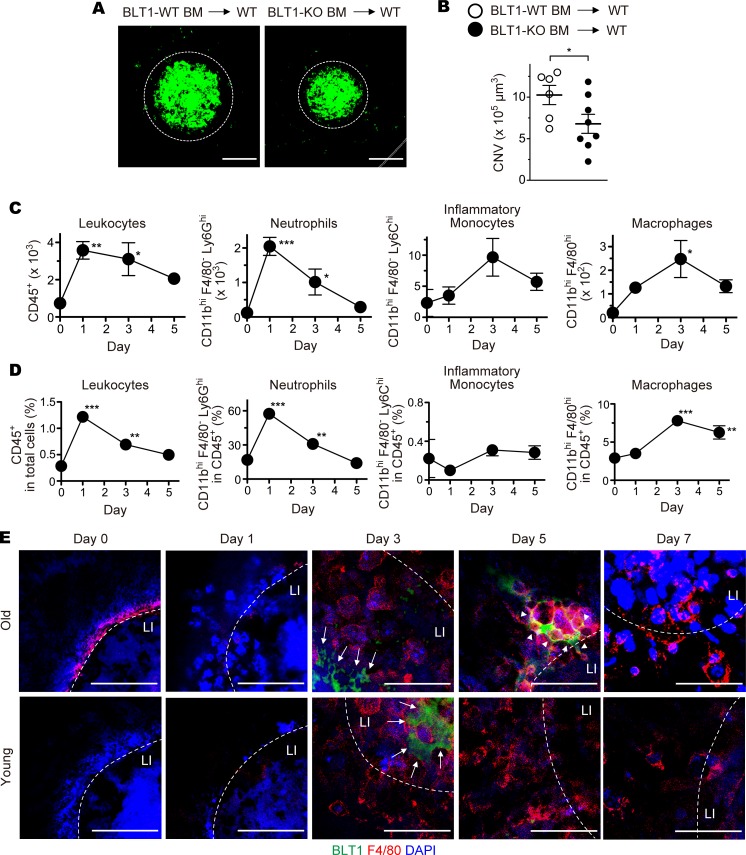
Figure 3. BLT1-expressing macrophages are recruited to the periphery of laser-induced CNV.
Images of iB4 staining (A) and CNV volume (B) in the RPE-choroid of chimeric mice receiving BM cells from aged BLT1-WT (white) or BLT1-KO (black) mice (>20 weeks old). n = 6–8 mice per group. (C and D) Flow cytometry analysis of cells isolated from the laser-injured eyes of aged WT mice (>20 weeks old). The populations of the leukocytes are gated as follows: total leukocytes, CD45+; neutrophils, CD11bhiF4/80–Ly6G+; inflammatory monocyte, CD11bhiF4/80–Ly6C+; macrophages, CD11bhiF4/80hi. The numbers (C) and percentages (D) of the leukocyte populations were analyzed on days 1, 3, and 5 after laser injury. Day 0 refers to a sample taken from uninjured eyes. n = 3–4 per group. (E) Immunofluorescence staining of the laser-injured RPE-choroids from WT mice (young, 8 weeks old; old, >20 weeks old) with anti-F4/80 (red) and -BLT1 (green) mAbs. Nuclei were visualized with DAPI (blue). LI (white dotted lines) denotes the location of laser injury. White arrows show F4/80-negative and BLT1-positive cells. White arrowheads show F4/80– and BLT1–double positive cells. Scale bar: 100 μm (A) or 50 μm (E). (B) *P < 0.05 (Student’s t test). (C and D) *P < 0.05; **P < 0.01; ***P < 0.005 versus Day 0 (1-way ANOVA with Dunnett’s post hoc test). Results are representative of at least 2 independent experiments.

