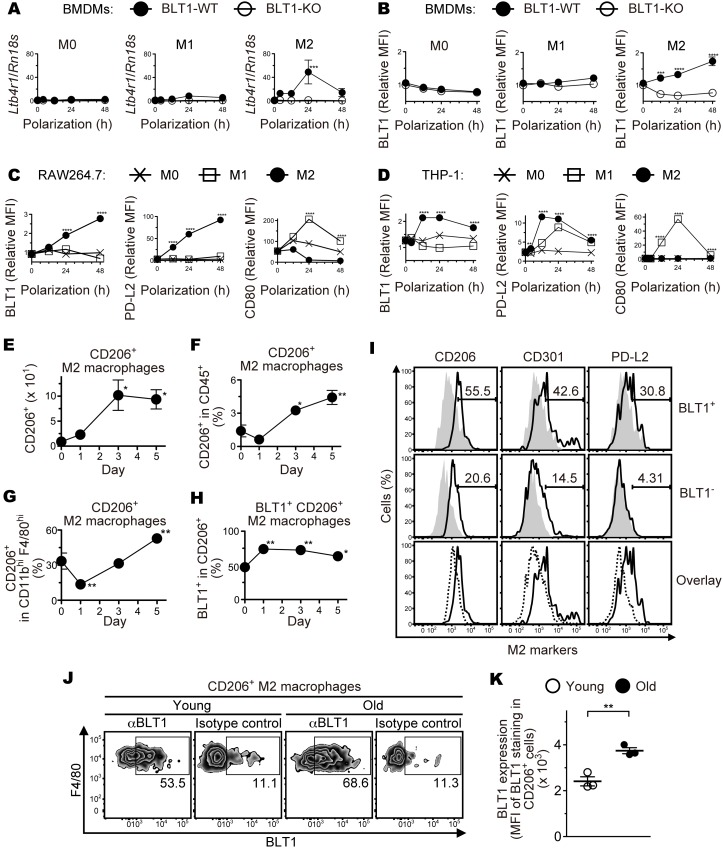
Figure 5. M2-type macrophages express BLT1 and infiltrate into the injured eyes of aged mice.
BMDMs from aged BLT1-WT (filled circles) and BLT1-KO (open circles) mice (>20 weeks old) were polarized to M1 and M2 macrophages, and BLT1 expression was examined by quantitative PCR (A) and Flow cytometry analysis (B). M0 denotes a sample of nonpolarized BMDMs. RAW264.7 (C) and THP-1 (D) cells were polarized to M0 (cross plots), M1 (open squares), and M2 (filled circles) macrophages, and expression of BLT1, PD-L2 (an M2 marker), and CD80 (an M1 marker) was examined by flow cytometry. The y axis shows the MFI relative to that of an isotype control (mouse IgG1). MFI, mean fluorescence intensity. n = 3 per group. (E–H) FACS analysis of M2 macrophages isolated from the laser-injured eyes of aged WT mice (>20 weeks old) as described in Figure 3, C and D. CD206+ M2 macrophages, CD11bhiF4/80hiCD206+; CD206+BLT1+M2 macrophages, CD11bhiF4/80hiCD206+BLT1+. n = 3–4 per group. (I) FACS analysis of M2 markers on the ocular-infiltrating BLT1+ and BLT1– macrophages on day 5 after laser injury from aged WT mice. CD206, CD301, and PD-L2 are specific surface markers of M2 macrophages. Cells were stained with anti-CD206, anti-CD301, and anti–PD-L2 mAbs (black outlines) or isotype controls (gray filled histograms). Overlays show the expression level of M2 markers on BLT1+ (black outlines) and BLT1– (black dotted lines) macrophages. These macrophages were gated as the CD45+F4/80hiCD11bhi population. (J and K) FACS analysis of BLT1 expression on the ocular-infiltrating CD206+ M2 macrophages on day 3 after laser injury from young or aged WT mice. n = 3 per group. (A–D) **P < 0.01; ***P < 0.005; ****P < 0.001 versus 0 hours (2-way ANOVA with Bonferroni’s post hoc test). (E–H) *P < 0.05; **P < 0.01 versus day 0 (1-way ANOVA with Dunnett’s post hoc test). (K) **P < 0.01 (Student’s t test). Results are representative of at least 2 independent experiments (A–I).

