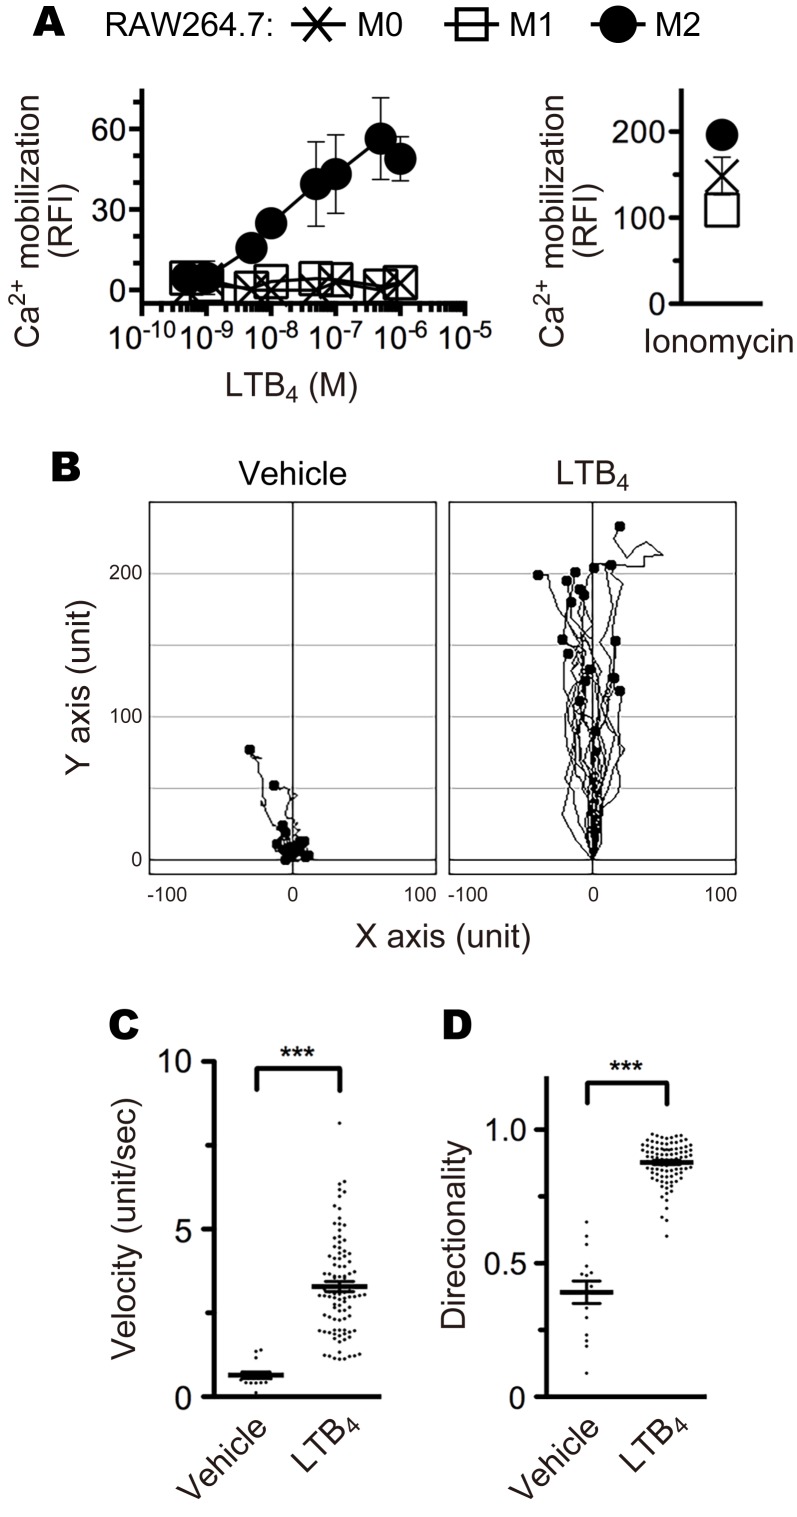
Figure 6. M2 macrophages respond to LTB4.
(A) Calcium mobilization in M0- (cross plots), M1- (open squares), and M2- (filled circles) RAW264.7 cells after stimulation with the indicated concentrations of LTB4 and 2 μM ionomycin. n = 3 per group. (B) Chemotaxis of M2-RAW264.7 cells toward 100 nM (highest concentration) of LTB4 (n = 18) or vehicle (n = 15). The velocity (C) and directionality (D) of M2-RAW264.7 cell migration in the presence of vehicle (n = 15) or 100 nM LTB4 (n = 93) are shown. (C and D) ***P < 0.005 (Student’s t test). Results are representative of at least 2 independent experiments.

