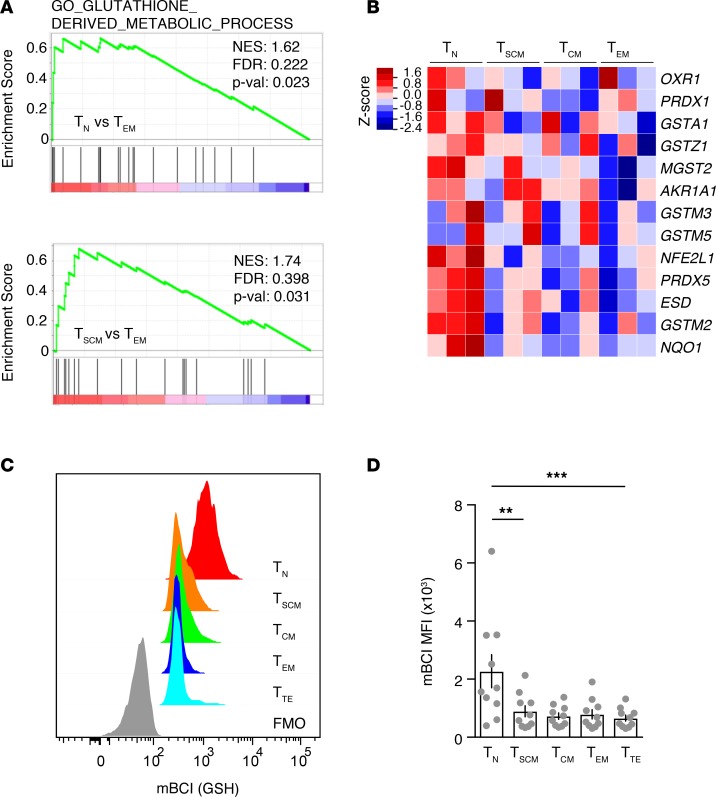
Figure 1. Early differentiated human CD8+ T cells display a substantial antioxidant phenotype.
(A) Gene set enrichment analysis (GSEA) of glutathione-derived metabolic process signature (gene ontology c5.pb.v6.1) in Tn versus Tem and Tscm versus Tem CD8+ T cells. Net enrichment score (NES) values are shown. (B) Relative gene expression level of transcripts involved in the antioxidant response in Tn, Tscm, Tcm, and Tem CD8+ T cell subsets from n = 3 HD. (C) Representative FACS analysis of GSH levels (mBCI staining) in gated CD8+ T cell subsets from the peripheral blood of a healthy individual. (D) Mean ± SEM of mean fluorescence intensity (MFI) data, obtained as in C (n = 10). HD, healthy donor; mBCI, monochlorobimane; FMO, fluorescence minus one control. In D statistical analysis was performed with parametric 1-way ANOVA test with Bonferroni post test. **P < 0.01, ***P < 0.001.

