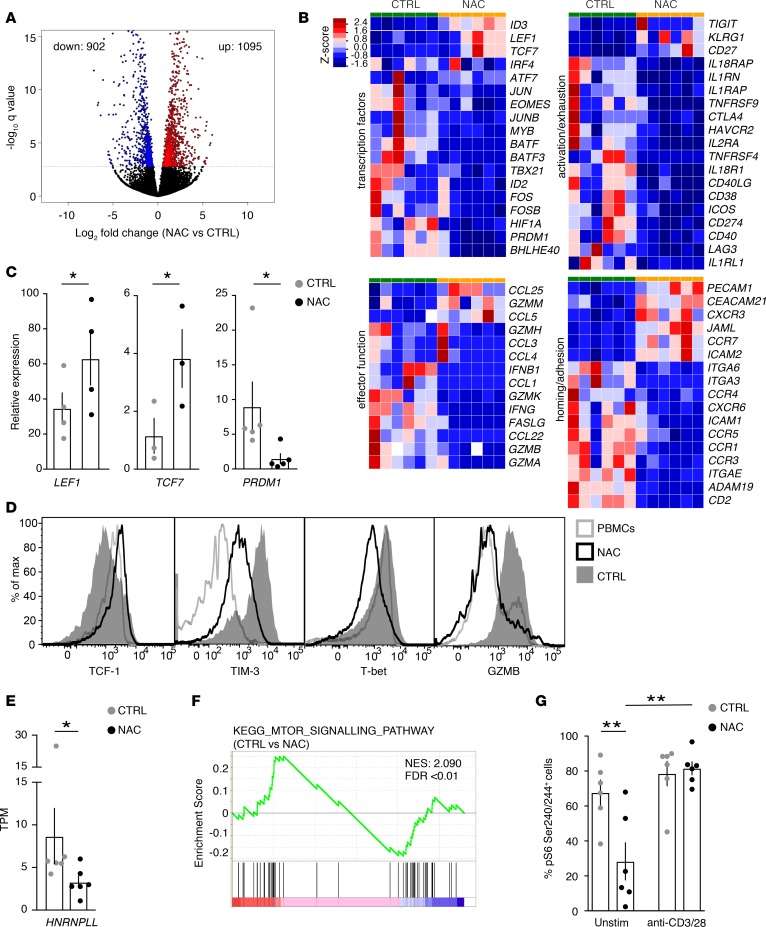
Figure 3. NAC establishes a gene expression signature of long-lived memory T cells.
(A) CD8+ Tn cells (n = 6) were activated in the absence (CTRL) or presence of NAC, as in Figure 2E, and their transcriptome was analyzed by RNAseq. Volcano plot representation of differentially expressed genes (DEGs) between NAC-treated and CTRL CD8+ T cells with a log2 fold change >1 and adjusted P < 0.05 (q value). (B) From left to right (top): relative expression level of TFs or activation/exhaustion related genes in CTRL versus NAC-treated samples; from left to right (bottom): relative expression level of effector function or homing/adhesion-related genes in CTRL versus NAC-treated samples. (C and D) Validation of selected RNAseq transcripts, as determined by qPCR (C; n = 3–5 HD in n = 2–3 exp.) or by FACS (D; similar data were obtained from n = 3 more HD). In D, a representative staining in PBMCs is depicted as an additional control. (E) Transcripts per million (TPM) (mean ± SEM) of HNRNPLL gene, as obtained from RNAseq data, as in A. *P < 0.05, paired Student’s t test. (F) Gene set enrichment analysis (GSEA) of mTOR signaling pathway (c2.cp.kegg.v6.1) between CTRL and NAC-treated CD8+ T cells from data as in A. (G) CD8+ Tn cells were activated in the absence (CTRL) or presence of NAC as in Figure 2E and then washed and restimulated with anti-CD3/28 for 30 minutes or left unstimulated. The bar graph shows the (mean ± SEM) frequencies of Ser240/244 pS6+ T cells (n = 6 HD from n = 2 exp.). Statistical analyses were performed with parametric paired Student’s t test (in C for LEF1 and TCF7 expression and E and G). In C, significance of PRDM1 expression was evaluated with nonparametric Wilcoxon test. *P < 0.05, **P < 0.01.

