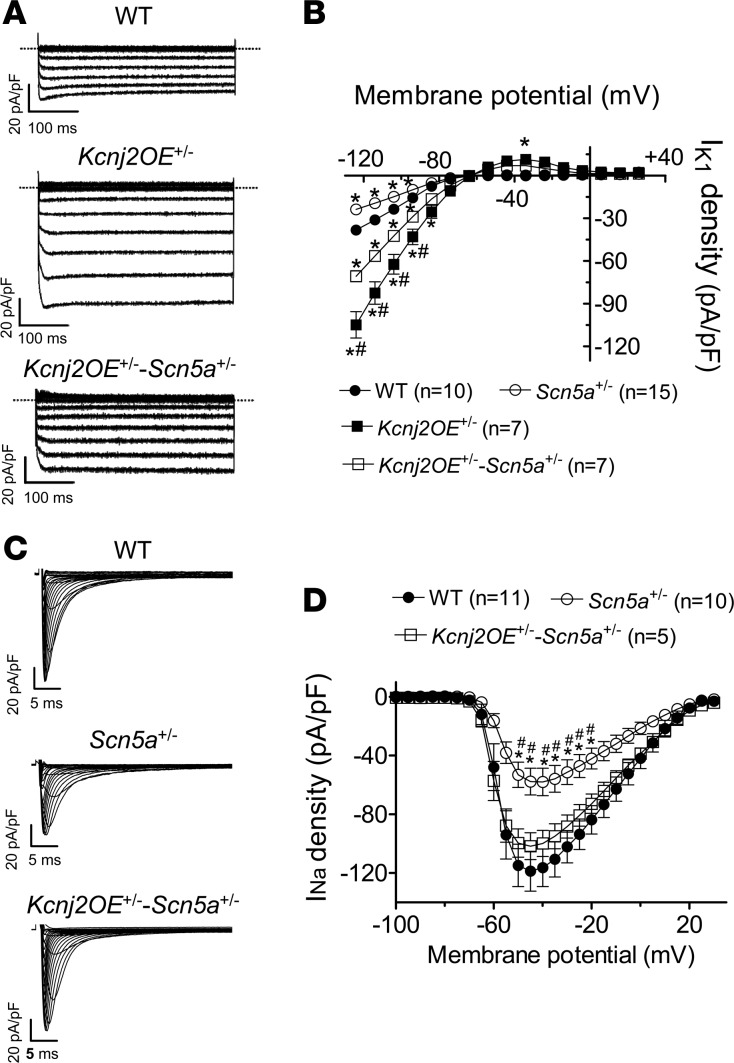
Figure 1. Heterozygous deletion of the SCN5A gene in mice concomitantly decreased the inward rectifier current, and Kir2.1 overexpression rescued the sodium current.
(A) Inward rectifier current (IK1) traces recorded in ventricular cardiomyocytes (CMs) from WT, Kcnj2OE+/–, and Kcnj2OE+/–-Scn5a+/– mice. (B) Mean current density-voltage curves for IK1 recorded in ventricular CMs from 3 WT (black circles), 4 Scn5a+/– (white circles), 3 Kcnj2OE+/– (black squares), and 3 Kcnj2OE+/–-Scn5a+/– (white squares) mice. (C) Sodium current (INa) traces recorded in ventricular CMs from WT, Scn5a+/-, and Kcnj2OE+/–-Scn5a+/– mice. (D) Mean current density-voltage curves for INa recorded in ventricular CMs from 3 WT (black circles), 3 Scn5a+/–, and 3 Kcnj2OE+/–-Scn5a+/– mice. Each point represents the mean ± SEM of n cells. One-way ANOVA followed by Newman-Keuls and multilevel mixed-effects model were used for comparisons. *P < 0.05 vs. WT; #P < 0.05 vs. Kcnj2OE+/–-Scn5a+/–.

