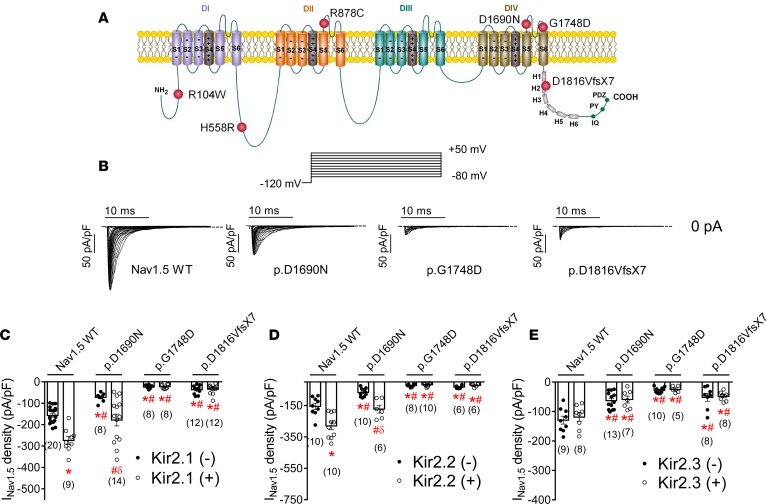
Figure 2. In CHO cells, cotransfection of Kir2.x may rescue Nav1.5 current generated by trafficking-defective Brugada syndrome–associated mutants in CHO cells.
(A) Topological diagram of the Nav1.5 channel showing the location of the mutations studied. The residue numbering corresponds to that of the transcript NM_198056.2. (B) Nav1.5 current (INav1.5) traces obtained by applying the protocol shown at the top in cells transfected with WT, p.D1690N, p.G1748D, and p.D1816VfsX7 Nav1.5 channels. Dashed lines represent the zero current level. (C–E) Peak INav1.5 density recorded in cells expressing WT or mutated Nav1.5 channels alone (black circles) or together (white circles) with Kir2.1 (C), Kir2.2 (D), or Kir2.3 (E) channels. Each bar represents the mean ± SEM of n cells from at least 3 different batches, and each dot represents 1 experiment. One-way ANOVA followed by Newman-Keuls and multilevel mixed-effects model were used for comparisons. *P < 0.05 vs. Nav1.5 WT alone; #P < 0.05 vs. Nav1.5WT+Kir2.x; δP < 0.05 vs. p.D1690N alone.

