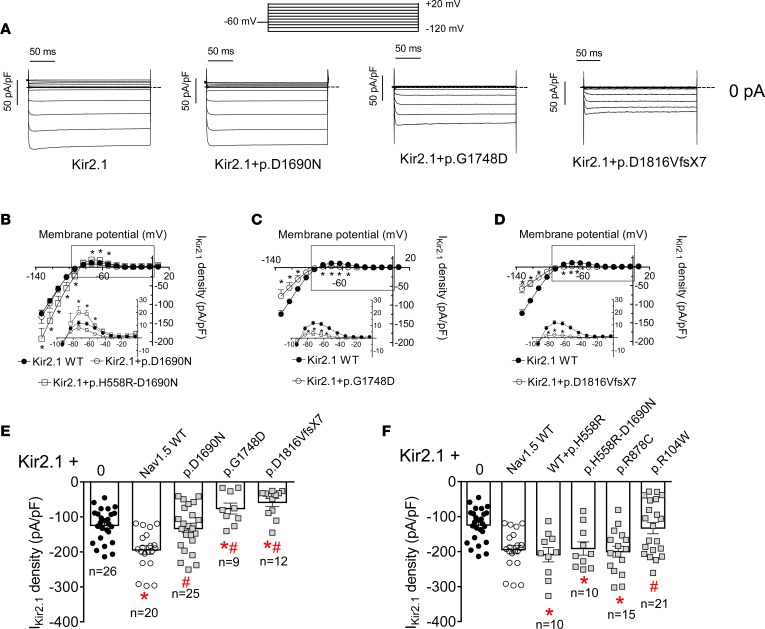
Figure 3. In CHO cells Kir2.1 current is reduced in the presence of trafficking-defective Brugada syndrome–associated mutated Nav1.5 channels.
(A) Kir2.1 current (IKir2.1) traces obtained by applying 250-ms pulses from –60 mV to potentials ranging between –120 and +20 mV in CHO cells transfected with Kir2.1 channels alone or together with p.D1690N, p.G1748D, and p.D1816VfsX7 Nav1.5 channels. Dashed lines represent the zero current level. (B–D) Mean current density-voltage curves for IKir2.1 recorded in cells expressing Kir2.1 alone (black symbols) or together (white symbols) with p.D1690N (B), p.H558R-D1690N (B), p.G1748D (C), and p.D1816VfsX7 (D) Nav1.5 channels. Insets in B–D: data at potentials positive to potassium equilibrium potential (EK) on an expanded scale. (E and F) IKir2.1 density at –120 mV generated in cells transfected with Kir2.1 channels alone or together with WT or mutated Nav1.5 channels. For comparison, data from cells cotransfected or not with WT Nav1.5 channels are also presented in F. Each data point/bar represents the mean ± SEM of n cells from at least 3 different batches, and each dot (in E and F) represents 1 experiment. One-way ANOVA followed by Newman-Keuls and multilevel mixed-effects model were used for comparisons. *P < 0.05 vs. Kir2.1 alone; #P < 0.05 vs. Kir2.1+Nav1.5 WT.

