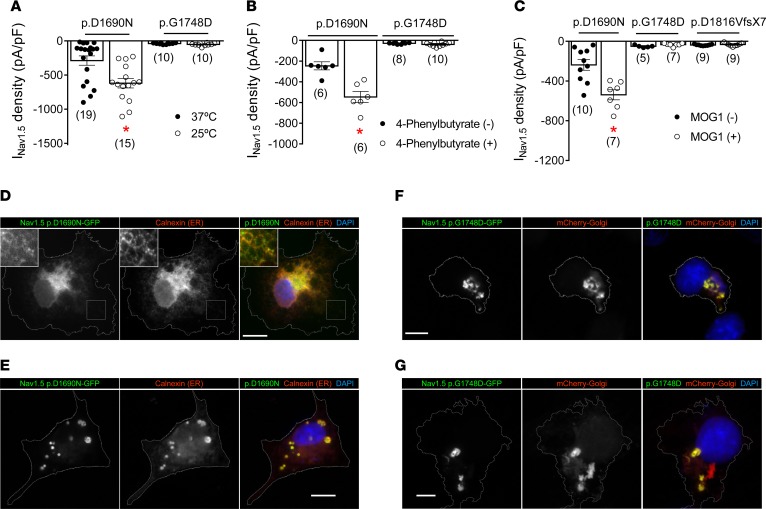
Figure 7. p.D1690N and p.G1748D are endoplasmic reticulum and Golgi trafficking–defective channels, respectively.
(A and B) Maximum Nav1.5 current (INav1.5) density generated by p.D1690N and p.G1748D channels in CHO cells incubated at 37°C (black circles) or 25°C (white circles) (A) or in the presence (white circles) or absence (black circles) of 4-phenylbutyrate (B). (C) Maximum INav1.5 density generated by WT or mutated Nav1.5 channels cotransfected (white circles) or not (black circles) with MOG1. *P < 0.05 vs. p.D1690N without treatment. Each bar represents mean ± SEM of n cells from at least 3 different batches, and each dot represents 1 experiment. Unpaired t test and multilevel mixed-effects model were used for comparisons. (D and E) Colocalization of Nav1.5 p.D1690N-GFP channels and the endoplasmic reticulum (ER) marker calnexin in 2 different COS cells representative of 3 different dishes. In D, inset images are included to make low-contrast highlighted regions visible. (F and G) Colocalization between Nav1.5 p.G1748D-GFP channels and the Golgi marker mCherry-Golgi in 2 different COS cells representative of 3 different dishes. Cell contours are delineated in gray for enhanced visualization. Scale bars: 25 μm.

