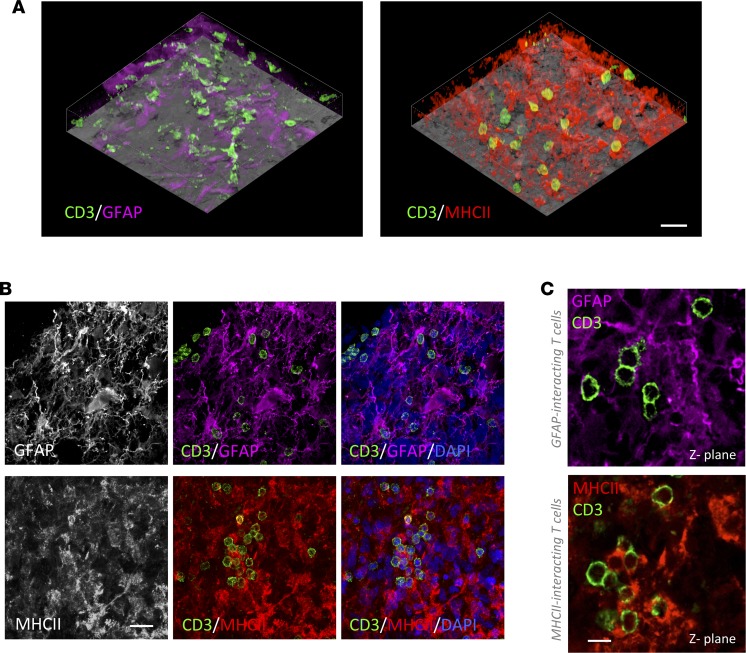
Figure 1. Infiltrated T cells in human GBM interact with both malignant GFAP+ cells and stromal MHCII+ cells.
(A) Tissue block transparencies allow the visualization of T cells (CD3+) infiltrated in malignant GFAP–rich and stromal MHCII–rich areas. Scale bar: 30 μm. (B) Images of the top panel show infiltration of T cells in GFAP+ tumor areas. Tumor cells are labeled with GFAP, and the infiltration of T cells can be clearly visualized within the tumor parenchyma. Nuclei are stained with DAPI. Images of the bottom panel reveal T cell infiltration in MHCII+ tumor areas. MHCII+ populated areas are infiltrated by T cells. Nuclei are visualized with DAPI. Scale bar: 20 μm. (C) Images of single 0.5 μm Z-planes show T cells interacting with GFAP+ cells or MHCII+ cells. Scale bar: 10 μm.

