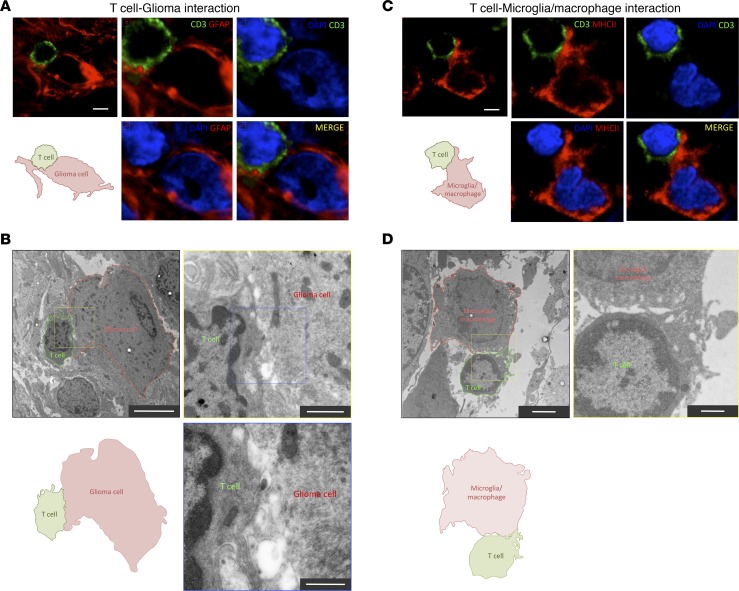
Figure 2. Evidence of bona fide T cell interactions with tumor and myeloid cells.
(A) High-resolution confocal scanning of a T cell–glioma cell interaction from a human GBM biopsy. A CD3+ T cell (green) contacts a GFAP+ glioma cell (red). A schematic diagram illustrates the interaction. Additional images show a zoom-in scanning at the interface of the interaction. In MERGE image, CD3 arrangement forms interdigitations with GFAP structures of the target cell. Scale bar: 5 μm. (B) Electron microscopy of a T cell–glioma cell interaction in a human GBM biopsy. A lymphocyte (outlined in green) interacting with a glioma cell (outlined in red) is depicted. Scale bar: 5 μm. A schematic diagram of the interaction is illustrated. (Top right) Higher magnification of the interface is shown from the indicated yellow square. Scale bar: 2 μm. The area of interaction presents some interdigitations of pseudopods. (Bottom right) Higher magnification is showed from the blue square. Scale bar: 500 nm. (C) High-resolution confocal scanning of a T cell establishing a close apposition with a MHCII+ cell in human GBM biopsy. A T cell is labeled with CD3 (green), and microglia/macrophages are visualized with MHCII (red) staining. A schematic diagram illustrates the interaction. Additional images show a zoom-in at the interface of the interaction. Scale bar: 5 μm. (D) Electron microscopy of a T cell–macrophage interaction in a human GBM biopsy. A lymphocyte (outlined in green) interacting with a myeloid cell (outlined in red) is depicted. Scale bar: 2 μm. A schematic diagram of the interaction is illustrated. (Top right) Higher magnification of the interface is shown from the yellow square. Scale bar: 500 nm.

