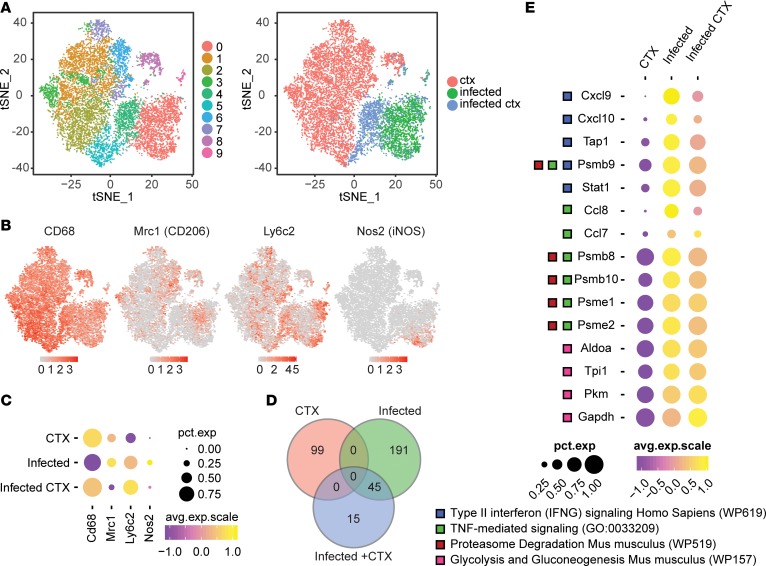
Figure 4. Transcriptional profiling of total macrophages during CTX-induced injury in uninfected and infected skeletal muscle.
Single-cell RNA sequencing was performed on macrophages isolated from uninfected CTX-injured (ctx), infected without CTX-injury (infected), and infected CTX-injured skeletal muscle. Data sets from each treatment group were aggregated for direct comparison. (A) t-SNE visualization of PCA and unsupervised cluster analysis performed on aggregated data set. Plot is annotated by bioinformatically identified clusters (left) and treatment group (right). (B) Scaled expression of Cd68, Mrc1, Ly6c2, and Nos2 overlaid on t-SNE plot of aggregated data set. (C) Dot plot representation of Cd68, Mrc1, Ly6c2, and Nos2 segregated by treatment group. Percentage expression of marker in each treatment group is represented by dot size. Average expression level in expressing cells is represented by color scale. (D) Venn diagram of differentially regulated genes identified in each treatment group. (E) GO and pathway enrichment analyses of 45 overlapping differentially regulated genes between infected and infected + CTX groups. Differentially regulated genes falling into selected significantly enriched terms and pathways are represented in the dot plot. Percentage expression of marker in each treatment group is represented by dot size. Average expression level in expressing cells is represented by color scale. Enriched terms and pathways were identified as significant at an adjusted P value ≤ 0.01 and FDR ≤ 0.05.

