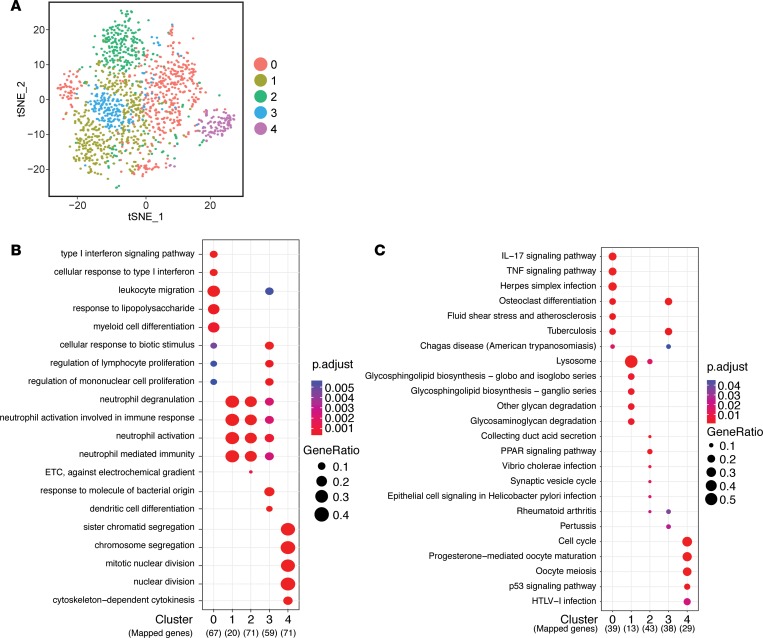
Figure 5. Identification and characterization of macrophage heterogeneity during tissue repair in uninfected muscle.
(A) t-SNE visualization of PCA and unsupervised cluster analysis from uninfected + CTX data set. (B and C) Top 5 terms identified by GO enrichment (B) and KEGG pathway (C) analyses for each cluster were plotted and compared between each cluster. Adjusted P value for each annotation is represented by color scale. Gene ratio is represented by dot size. Enriched terms and pathways were identified as significant at an adjusted P value ≤ 0.01 and FDR ≤ 0.05.

