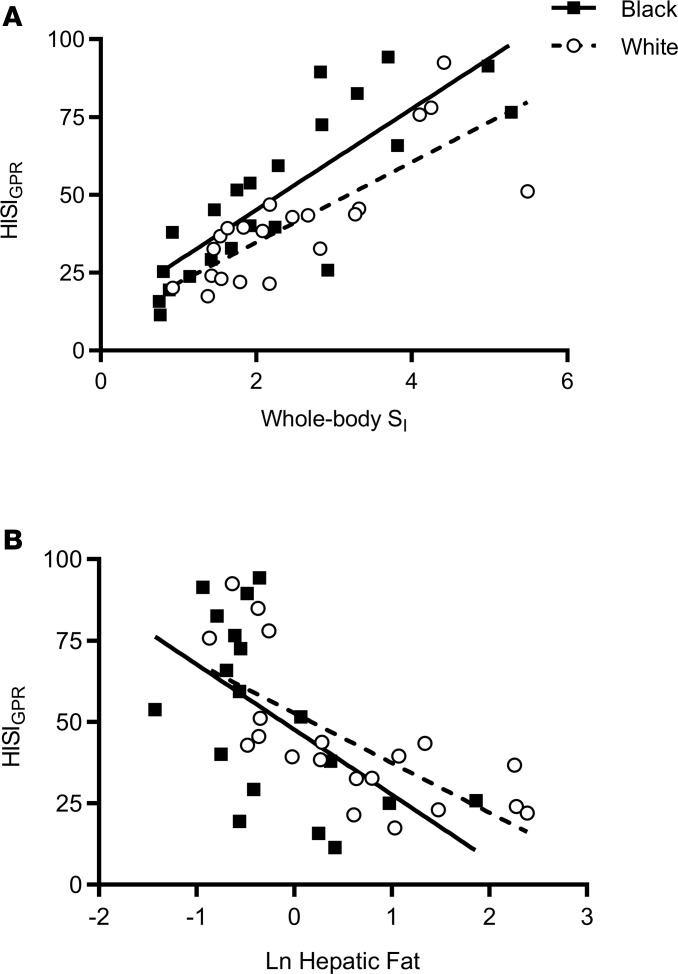
Figure 4. Relationship of hepatic insulin sensitivity index with whole-body insulin sensitivity and hepatic fat.
(A) Scatter plot of hepatic insulin sensitivity index (HISIGPR) with whole-body insulin sensitivity (SI) in Black women (black squares and solid line, n = 22) and White women (white circles and dotted line, n = 21). Using linear regression analyses, Black women had higher HISIGPR at any given level of whole-body SI (β = 11.8; 95% CI: 3.1, 20.4; adjusted R2 = 0.64; P < 0.01). There was no interaction between whole-body SI and race (P > 0.50). (B) Scatter plot of HISIGPR with Ln hepatic fat in Black women (black squares and line, n = 18) and White women (White circles and dotted line, n = 20). Ln, natural log-transformed. Pearson correlations were used to determine correlation coefficients (black, r = –0.6, and White, r = –0.7, P ≤ 0.01).

