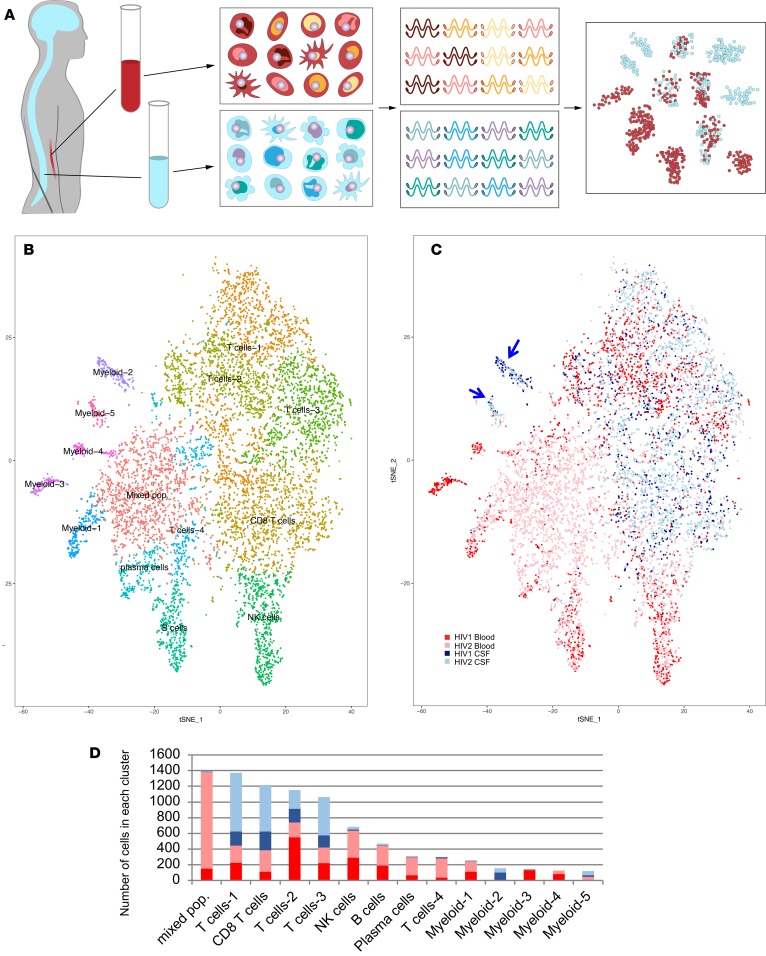
Figure 1. Single-cell RNA sequencing of paired blood and CSF samples.
(A) CSF and blood were collected and processed in parallel. Single PBMCs and CSF cells were applied to separate arrays, with 10,000 cells applied to each SeqWell array. Single-cell whole transcriptomes were tagged to retain information about the cell, and then sequenced. Sequencing data from single cells was pooled for cluster analysis based on differential gene expression, revealing clusters that are composed predominantly of CSF cells. (B) t-Distributed Stochastic Neighbor Embedding (tSNE) visualization of cell populations identified through unsupervised cluster analysis of blood and CSF derived from 2 HIV+ individuals (HIV1 and HIV2). Clusters are labeled based on expression of canonical marker genes (see also Supplemental Figure 1). (C) tSNE visualization of cells, labeled by sample (HIV1 or HIV2) and tissue (CSF or blood) of origin, revealing 2 myeloid clusters that are predominantly composed of CSF cells (blue arrows). (D) Bar plots quantifying the number of cells from blood and CSF from each sample in each cluster.

