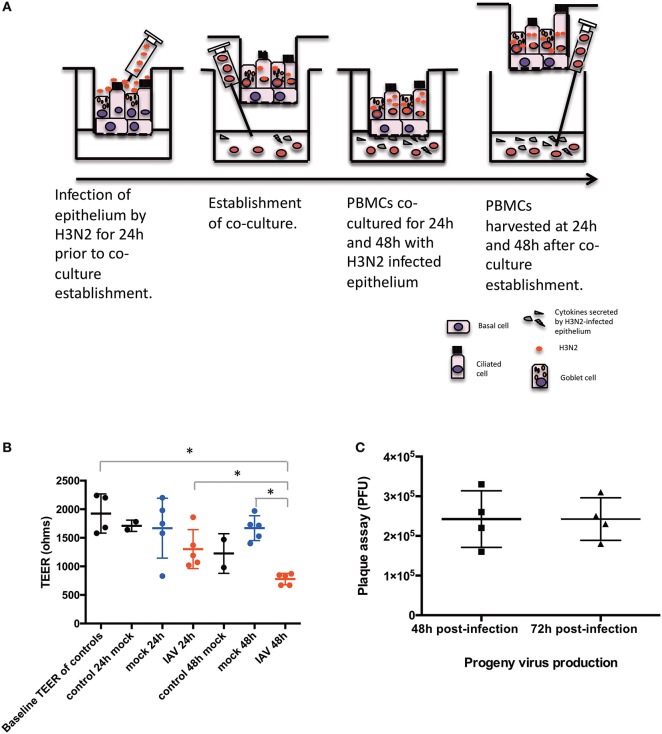
Figure 1.
Diagram of the conditions of the study. (A) Time-points and settings of the co-culture. (B) Transepithelial electrical resistance (TEER) measurements post co-culture establishment. Control, hNEC only; mock, hNEC with PBMC in RPMI; IAV, IAV-infected hNEC with PBMC in RPMI. (C) Progeny viruses detected by viral plaque assay from apically applied H3N2 inoculum. ***P < 0.001; **P < 0.01; *P < 0.05; NS, not significant.

