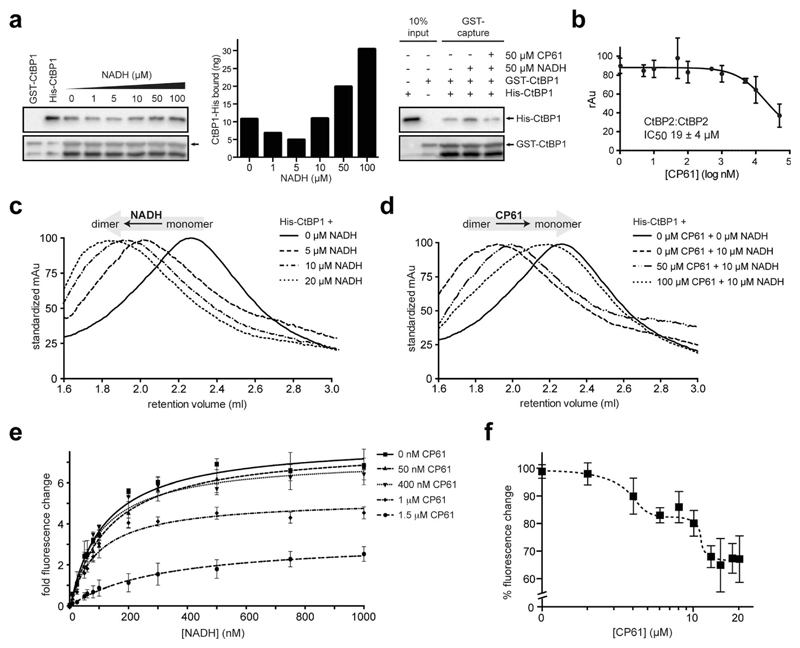
Fig. 4.
Analysis of the inhibition of CtBP dimerization by CP61 in vitro. (a) Left hand panel shows GST–CtBP1 capturing increasing amounts of His–CtBP1 with increasing concentrations of NADH, as quantified in the middle panel. Right hand panel shows GST–CtBP1 capturing His–CtBP1 in the absence or presence of NADH and CP61, showing disruption of CtBP1 dimerization by CP61. (b) GST–CtBP2 and His–CtBP2 were incubated with CP61 prior to the addition of NADH and quantification of CtBP2 dimer formation by ELISA. Data points are mean ± SD of two independent experiments, each with triplicated wells. (c) Size exclusion chromatography of His–CtBP1 shows transition of monomer to dimer upon addition of increasing concentrations of NADH. (d) Size exclusion chromatography of His–CtBP1 with 10 μM NADH shows dose-dependent disruption of dimer formation by CP61. (e) A FRET-based CtBP1/NADH-binding assay shows a dose dependent reduction in FRET signal (at 425 nm) with increasing CP61, suggesting allosteric inhibition by CP61. Data fitted by nonlinear regression. (f) NADH–CtBP1 interaction by FRET shows the effect of increasing CP61 concentration with NADH fixed at 1 μM. X-axis is plotted on a log scale to demonstrate saturation of binding at higher CP61 concentrations.

