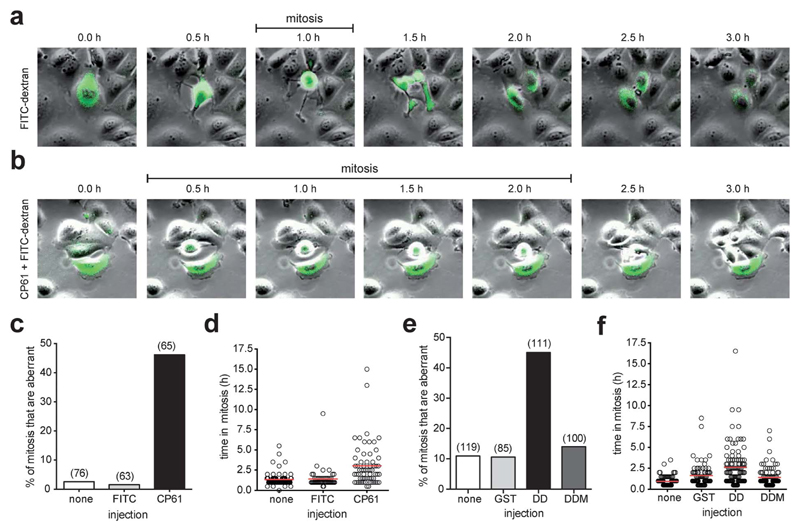
Fig. 7.
Effect of microinjected CtBP dimerization inhibitors on mitotic fidelity of cell cycle synchronized MCF-7 cells, quantified using time-lapse video microscopy. (a) Montages showing examples of mitoses in MCF-7 cells injected with FITC-dextran (green). (b) Montage of mitosis in MCF-7 cells injected with CP61 + FITC-dextran (green); the cell in the center of the image is undergoing an extended mitosis, as evident from the prolonged period of rounding (0.5 h to 2.0 h frames) compared to control treated cells (panel (a), 1.0 h frame only). Also see ESI videos 3–5.† (c) The percentage of cells in which the first mitosis was phenotypically abnormal was scored for MCF-7 cells injected with FITC-dextran (FITC), CP61 + FITC-dextran (CP61) or non-injected cells (none). Numbers in brackets indicate number of mitoses assessed. (d) Each mitotic cell assessed in (c) was scored for the length of time in mitosis. Red line shows average time in mitosis. (e) The percentage of cells in which the first mitosis was phenotypically abnormal was scored for MCF-7 cells injected with GST–CtBPDD (DD) or the dimerization incompetent GST–CtBPDD(R147L,R169L) analogue (DDM) proteins into MCF-7 cells. Numbers in brackets indicate number of cells assessed. (f) Each mitotic cell in (e) was scored for the length of time in mitosis. Red bars show mean time in mitosis. The above CtBP dimerization inhibitors did not substantially reduce the proportion of cells that undergo mitosis (Fig. S5†).

