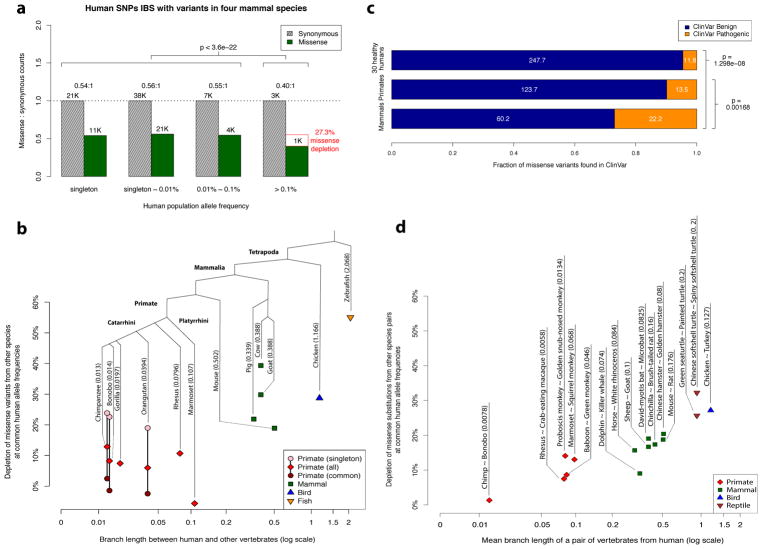
Figure 2. Purifying selection on missense variants identical-by-state with other species.
a, Allele frequency spectrum for human missense and synonymous variants that are identical-by-state with variants present in four non-primate mammalian species (mouse, pig, goat, cow). The depletion of missense variants at common human allele frequencies (>0.1%) is indicated by the red box, along with the accompanying χ2 test p-value. b, Scatter plot showing the depletion of missense variants observed in other species at common human allele frequencies (>0.1%) versus the species’ evolutionary distance from human, expressed in units of branch length (mean number of substitutions per nucleotide position). The total branch length between that species number appearing in parentheses beside each species’ name indicates the total branch length between that species and human. Depletion values for singleton and common variants are shown for species where variant frequencies were available, with the exception of gorilla, which contained related individuals. c, Counts of benign and pathogenic missense variants in a cohort of 30 humans sampled from ExAC/gnomAD allele frequencies (top row), compared to variants observed in primates (middle row), and compared to variants observed in mouse, pig, goat, and cow (bottom row). Conflicting benign and pathogenic assertions and variants annotated only with uncertain significance were excluded. d, Scatter plot showing the depletion of fixed missense substitutions observed in pairs of closely related species at common human allele frequencies (>0.1%) versus the species’evolutionary distance from human (expressed in units of mean branch length).

