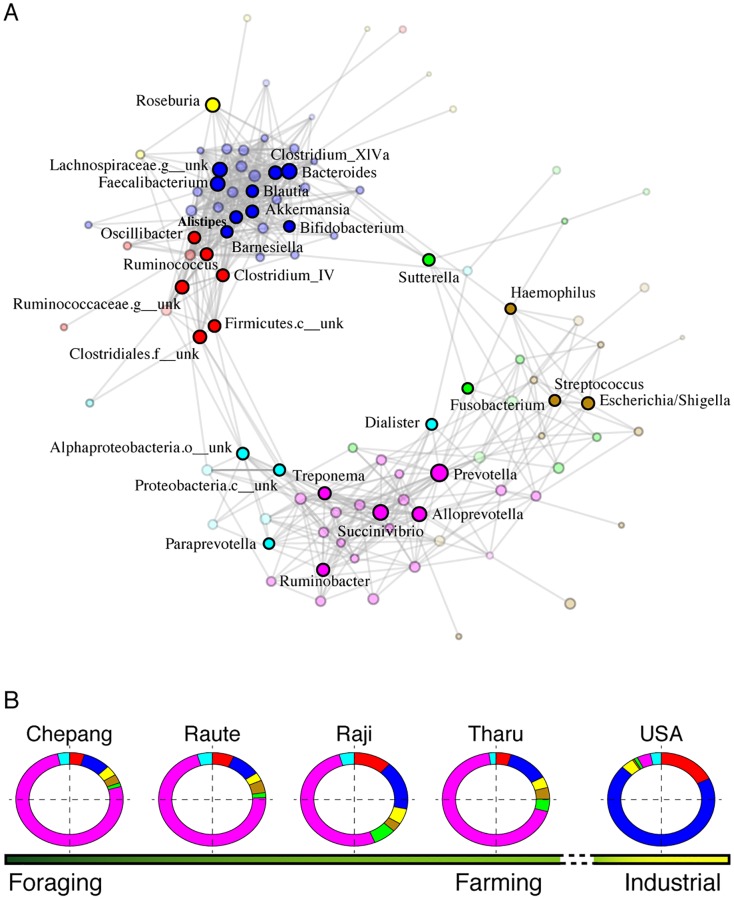
Fig 6. Microbial coabundance networks across lifestyles.
(A) Visualization of the occurrence patterns of bacterial genera using the Fruchterman–Reingold force–directed layout algorithm. Nodes (circles) represent bacterial genera, node colors represent the seven CAGs, and node sizes represent genus abundance. Only the most dominant genera in each CAG are labeled. Edges represent the significant and positive correlations between genera. Members of the red, blue, and yellow CAGs are tightly correlated to one another and mostly negatively correlated with the members of cyan, magenta, gold, and green CAGs. Labels with “x__unk” indicate taxa with unknown classification level. (B) The relative proportions of these CAGs vary across the lifestyle gradient. Chepang foragers show elevated proportion of the magenta CAG, which is dominated by Prevotella, Succinivibrio, Ruminobacter, and Treponema. This CAG decreases in the Raute, Raji, and Tharu farmers with concurrent increase in the blue CAG, which is dominated by Bacteroides, Faecalibacterium, and Bifidobacterium. The American gut is dominated by the blue CAG and highly depleted of the magenta CAG. The data underlying this figure can be found in S1 Data. c, class; CAG, coabundance group; f, family; g, genus; o, order.

