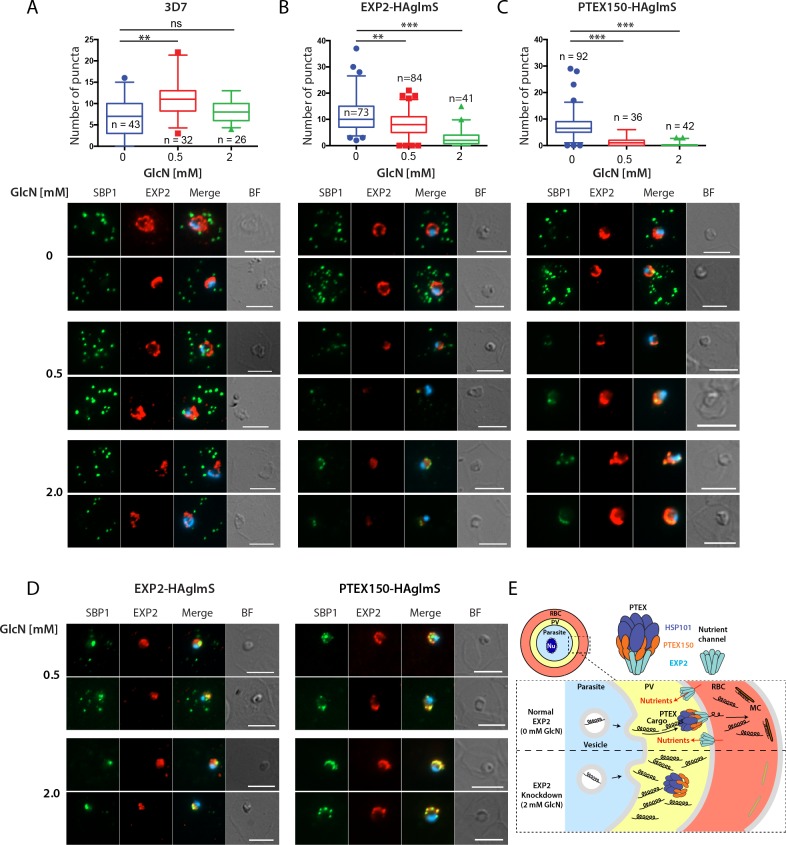
Fig 4. Knockdown of PTEX proteins EXP2 and PTEX150 reduces protein export into host erythrocytes.
Export of Maurer’s cleft SBP1 protein after one cycle of GlcN treatment at 8 hpi rings by widefield microscopy in (A) 3D7, (B) EXP2-HAglmS and (C) PTEX150-HAglmS parasites. (Top) Quantitation of the number of SBP1 puncta in the parasites from n = number of individual cells counted. Kruskall-Wallis test used *p<0.01, **p<0.005, *** p < 0.0001. (Bottom) Representative immunofluorescence images showing reduced export of SBP1 structures after treatment of parasites with 0, 0.5 and 2 mM GlcN. Parasites were probed with rabbit anti-SBP1 serum (green), EXP2 mouse monoclonal IgG (red) and merged with DAPI DNA stain (blue). BF, brightfield. The brightness and contrast for SBP1 and EXP2 were equally adjusted for each image based on 3D7, 0 mM GlcN. (D) Images of GlcN-treated EXP2-HAglmS and PTEX150-HAglmS parasites in which the SBP1 and EXP2 signal has been enhanced. All size bars = 5 μm. (E) Diagram showing how knockdown of EXP2 blocks protein export. PTEX structure derived from Ho et al. (2018)[13]. RBC, red blood cell; PV, parasitophorous vacuole; Nu, nucleus; MC, Maurer’s cleft.

