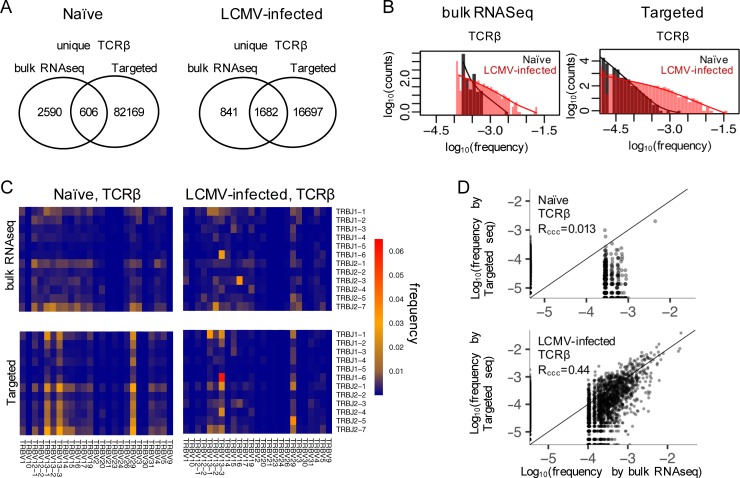
Fig 3. TCR profiling by bulk RNAseq.
A) Unique TCRβ sequences detected in the non-challenged (naïve) and the LCMV-infected mouse splenic CD8+ T cells by bulk RNAseq, compared to the results obtained by the 5’ RACE targeted TCR sequencing. B) Abundance distribution of TCRβ sequences in the naïve and the LCMV-infected splenic T cells measured by the bulk RNAseq (left panel) or the targeted sequencing (right panel). The x-axis is the abundance (i.e. frequency) of each TCRβ and the y-axis is the number of TCRβ sequences at that abundance. C) Usage of the TRBV and TRBJ genes in the naïve and the LCMV-infected splenic T cells, measured by the bulk RNAseq (upper two panels) or the targeted sequencing (bottom two panels). The union of the TRBV (and TRBJ) genes detected in the two approaches are presented. D) Comparison of the quantitative estimation of the abundance (i.e. frequency) of TCRβ sequences that are commonly detected by both the bulk RNAseq and the targeted sequencing, under naïve or LCMV-challenged conditions.

