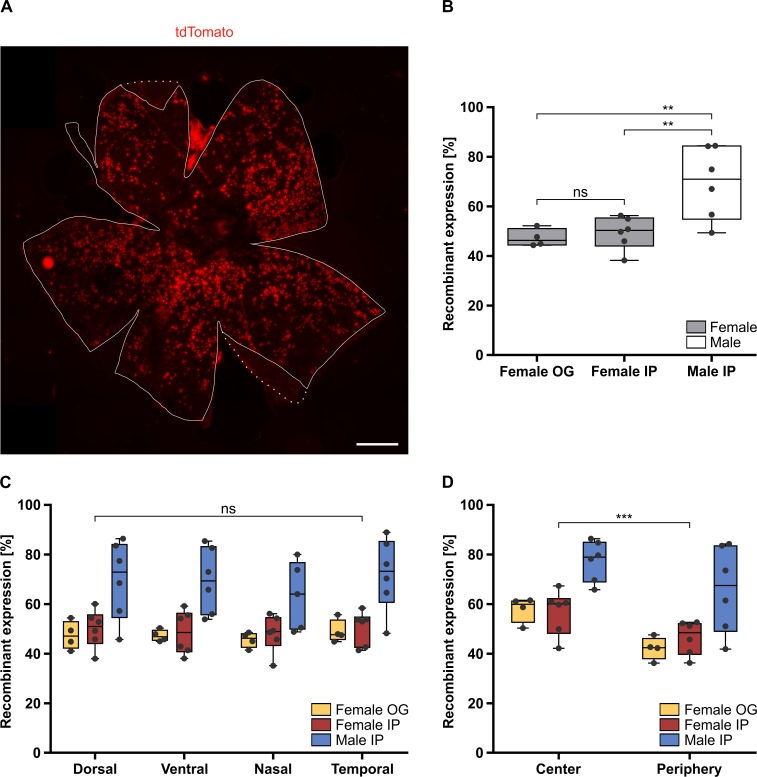
Fig 5. Analysis of Cre-mediated recombinant expression and its overall distribution in the adult Ai14;RPE-Tyrosinase-CreErT2 RPE.
A: Fluorescent image showing the uniform distribution of tdTomato expressing cells throughout an adult RPE flatmount preparation. Outline of the RPE indicated by the solid line, dotted line represents inverted choroidal tissue. B: Quantification of recombinant expression in RPE of female mice, treated via oral gavage (OG) (47.25%) (n = 4 eyes) compared to female mice treated via intraperitoneal injection (IP) (49.35%) (n = 6 eyes) showed similar levels of recombinant expression (p = 0.949). The difference between male (69.48%) (n = 6 eyes) and female mice, both treated via IP, is statistically significant (p = 0.0029). C: Quantification of the recombinant expression in dorsal, ventral, nasal and temporal areas of the RPE in three different treatment conditions (Female OG, Female IP and Male IP) showed no significant regional differences (p = 0.9995, p = 0.5315). D: Quantification of the recombinant expression in central vs. peripheral areas of the RPE in the three different treatment conditions (Female OG, Female IP and Male IP) showed a significant difference (p = 8.60E-07). Significance levels: > 0.05 not significant (ns), ≤ 0.05 *, ≤ 0.01 **, ≤ 0.001 ***. Scale bar: (A) 500 μm.

