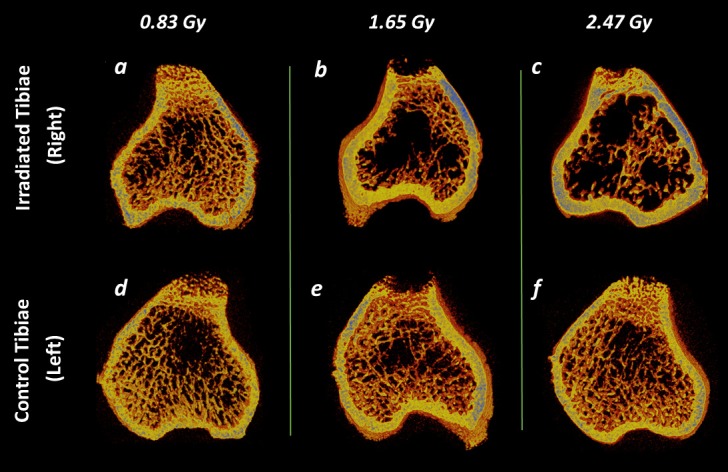
Fig 9. Trabecular and cortical bone representation after the 9-weekly in vivo micro-CT scans.

(a—f) Representative 3D micro-CT images of metaphyseal bone structure of the irradiated (right) and non-irradiated control (left) tibiae at 14th week of age after 0.83, 1.65 and 2.47 Gy radiation doses during the rat adolescent period. 3D micro-CT images within each radiation dose portray tibiae from the same rat, randomly selected to be representative of its respective dose group.
