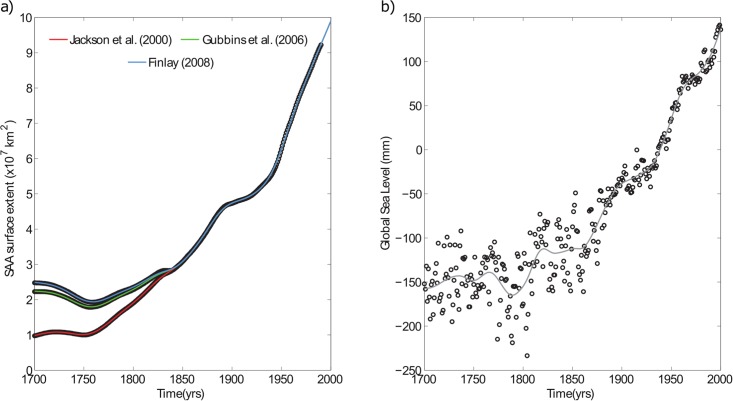
Fig 1. Time series evolution.
Evolution of a) the SAA area extent (within the 32000 nT isoline of the geomagnetic field) on the Earth’s surface in km2 from three global geomagnetic field models [27, 35, 36] and b) GSL rise in mm, for the last 300 years (1700–2000). The lines represent the fits by using penalized cubic splines: (red, green, blue) SAA derived from Jackson et al. [35], Gubbins et al. [27] and Finlay [36], respectively, and (gray) GSL.

