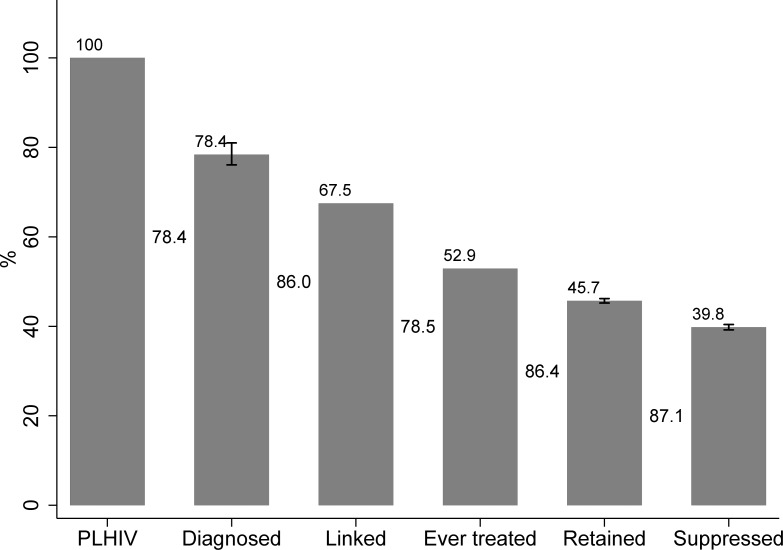
Fig 1. Cascade of care for the total population of PLHIV.
The numbers between the bars correspond to proportion of the previous stage, while the numbers above the bars correspond to proportions of PLHIV. Vertical lines on the top of the Diagnosed, Retained to care and Virally suppressed bars correspond to 95% Confidence Intervals.

