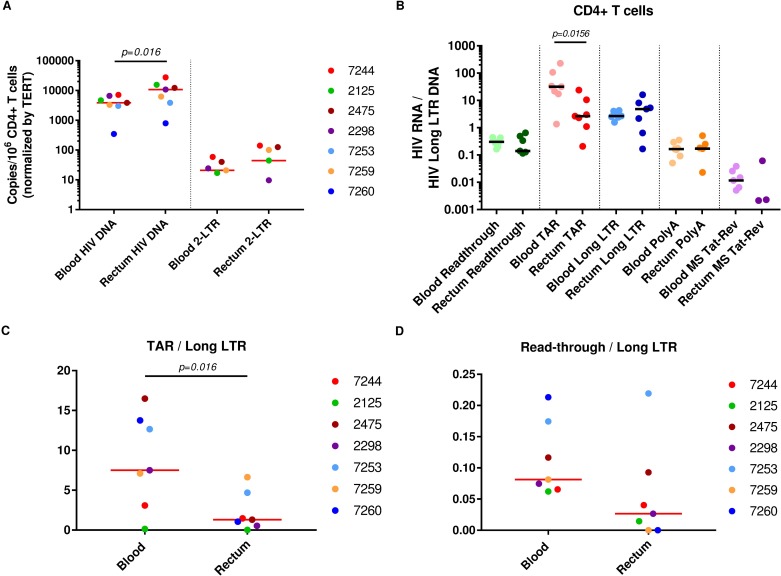
Fig 4. Levels of HIV DNA, 2-LTR circles, and blocks to transcription differ between CD4+ T cells from the gut and blood.
(A) Levels of HIV DNA (Long LTR region) and 2-LTR circles were quantified in CD4+ T cells from the blood and rectum using ddPCR and expressed as copies per million CD4+ T cells (normalized by TERT). (B) The average levels per provirus of each transcript (ratio of each HIV RNA to the Long LTR HIV DNA) were measured in CD4+ T cells isolated from the blood and rectum (n = 7 matched individuals). (C) The ratio of TAR to Long LTR RNA was determined to compare the block to transcriptional elongation in CD4+ T cells from the blood and rectum. (D) The ratio of Read-through to Long LTR RNA was determined to assess the contribution of transcriptional interference to the block to HIV transcription initiation in rectal CD4+ T cells relative to peripheral CD4+ T cells. Bars represent medians. Comparisons between transcripts were performed using the Wilcoxon signed-rank test.

