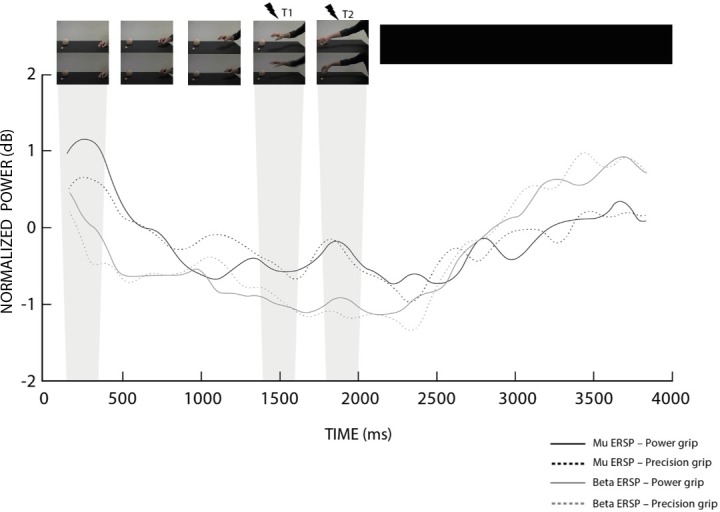
Fig 1. Time course of Mu and beta EEG rhythms.

The graph shows the spectral perturbation of Mu (8–12 Hz) and beta (15–23 Hz) bands recorded in the left hemisphere (C3). The ‘X’ axis represent the time in milliseconds; whereas T1 (1500ms) and T2 (1900ms), represent the instants of TMS pulses and grey rectangles highlight the correspondent time-bin of EEG analyses. The ‘Y’ axis represents the log transformed ratio of the power at each time point relative to the average power of the respective condition. At the top of the figure we illustrate in a few frames the action presented in the video clips.
