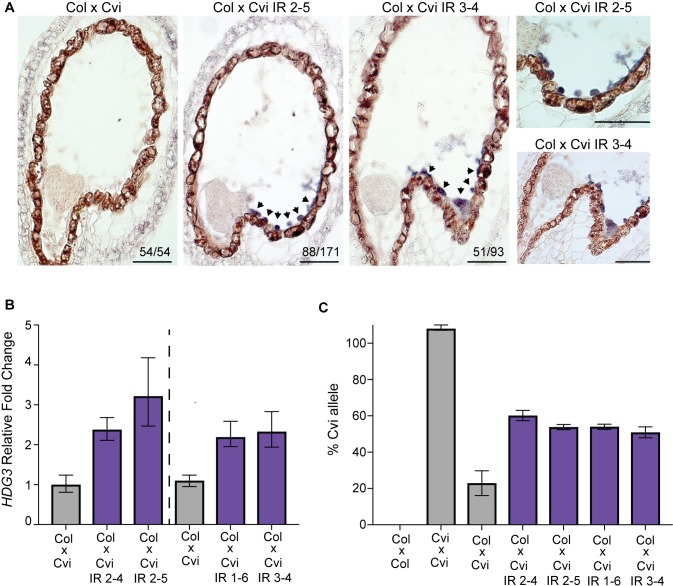
Fig 5. HDG3 is imprinted in Cvi HDG3 IR lines.
(A) HDG3 in situ hybridization for indicated genotypes. Arrowheads indicate regions of in situ signal. Right panels shows magnification of chalazal region. Scale bars, 50 μm. (B) RT-qPCR of relative HDG3 transcript abundance in F1 endosperm at 6–7 DAP. Dashed line separates experiments done at different times. Left, avg of 3 technical replicates. Right, avg of biological duplicates. Bars show upper and lower range. (C) % of HDG3 from Cvi allele in endosperm by TaqMan RT-qPCR assay.

