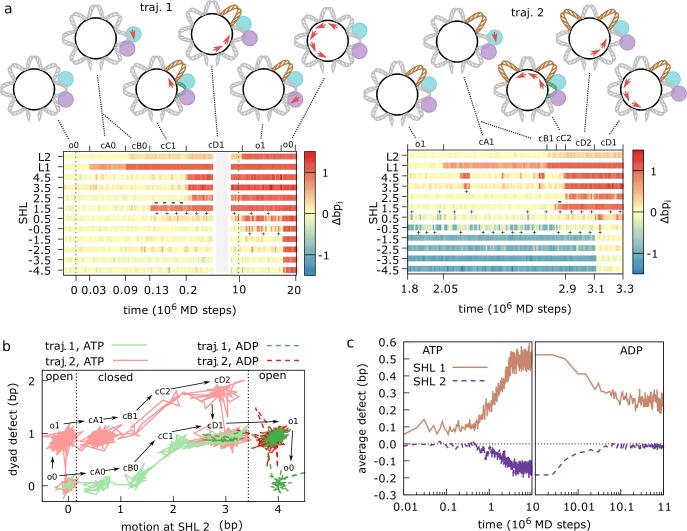
Fig 4. Active nucleosome repositioning via twist defect propagation for polyApG sequence.
(a) Timelines of the translocase (L1 and L2) and nucleosome contact indexes (SHL -4.5 to 4.5) for two representative trajectories where nucleosomal DNA slides by 1 bp relative to the initial configuration. The intermediate configurations along the repositioning pathway are indicated by the corresponding labels (described in the main text) and cartoons. The key twist defects facilitating repositioning are highlighted by a plus sign for +1bp defects (in brown in the cartoons) and by a minus sign for -1bp defects (in green in the cartoons). DNA and translocase lobes (1 in cyan, 2 in purple) motions are indicated by red arrows. ATP binding occurs at time 0, whereas ATP hydrolysis occurs at 107 MD steps. (b) 2-dimensional projections of the trajectories in panel a (traj. 1 in green, traj. 2 in red; lighter solid lines for the ATP state, darker dashed lines after hydrolysis; time increases in the direction indicated by the arrows). The x-axis represents the sum of the translocase and nucleosome contact indexes around the remodeler binding location at SHL 2: ΔbpL1+ΔbpL2+Δbp1.5+Δbp2.5. The y-axis represents the size of the twist defects at the three central SHLs: Δbp1.5-Δbp-1.5. The key metastable states along the repositioning pathways, indicated by the same labels used in panel a, can be well distinguished as individual clusters on this low-dimensional projection. (c) Twist defect coordinates at SHL 1 (= Δbp1.5-Δbp0.5, brown, solid line) and SHL 2 (= Δbp2.5-Δbp1.5, purple, dashed) averaged over 100 MD trajectories as a function of time, showing how twist defects are formed after ATP binding and translocase closure (at 0 MD steps; panel c, left), and how they are released after hydrolysis and translocase opening (at 107 MD steps; panel c, right).

