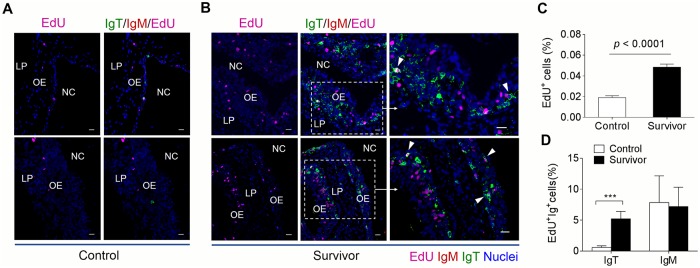
Fig 8. Proliferative responses of IgT+ and IgM+ B cells in the olfactory organ of survived trout.
Immunofluorescence analysis of EdU incorporation by IgT+ or IgM+ B cells in olfactory organ of control (A) and survivor fish (B). Nasal paraffin sections were stained for EdU (magenta), trout IgT (green), trout IgM (red) and nuclei (blue) detection (n = 8 fish per group). NC, nasal cavity; OE, olfactory epithelium; LP, lamina propria. Scale bars, 20 μm. (C) Percentage of EdU+ cells from total nasal cell in control or survivor fish counted from Fig 7A and 7B (n = 8). (D) Percentage of EdU+ cells from the total IgT+ or IgM+ B cells populations in olfactory organ of control and survivor fish counted from A and B. Data in A and B are representative of at least three independent experiments (mean and s.e.m.). Statistical analysis was performed by unpaired Student’s t-test. *P < 0.05, **P < 0.01 and ***P < 0.001.

