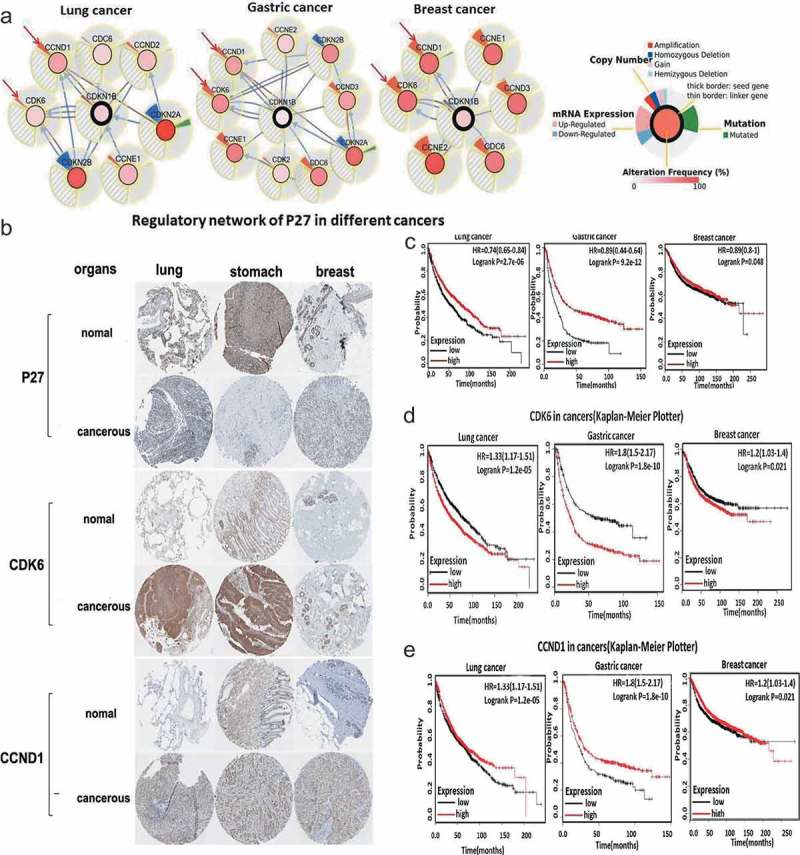
Figure 2.

Functions of p27, CDK6, and CCND1 in tumors. (a) Analysis of Mutations in Other Genes in p27-mutated tumors (www.cbioportal.org/), the marked genes were significant changes in the range, the outer circle showed the result of genes copy number analysis, expression change analysis, mutation analysis. The inner ring belongs to P27 mutation frequency analysis. (b) Analysis of the expression of p27, CDK6, and CCND1 in tumors and corresponding normal tissues. Tumors including lung cancer, gastric cancer and breast cancer. The analysis data were derived from the immunohistochemical results of the database of Proteinatas (www.proteinatlas.org). (c) P27 in gastric, lung, and breast cancer (Kaplan–Meier Plotter). Kaplan–Meier plots showing OS in adenocarcinomas. In red: patients with expression above the median and in black, patients with expressions below the median. Kaplan–Meier plots revealed the correlation between gene expression and OS rate. (d) CDK6 in gastric, lung, and breast cancers (Kaplan–Meier Plotter). Kaplan–Meier plots showing OS in adenocarcinomas. In red: patients with expression above the median and in black, patients with expressions below the median. Kaplan–Meier plots revealed the correlation between gene expression and OS rate. (e) CCND1 in gastric, lung, and breast cancers (Kaplan–Meier Plotter). Kaplan–Meier plots showing OS in adenocarcinomas. In red: patients with expression above the median and in black, patients with expressions below the median. Kaplan–Meier plots revealed the correlation between gene expression and OS rate.
