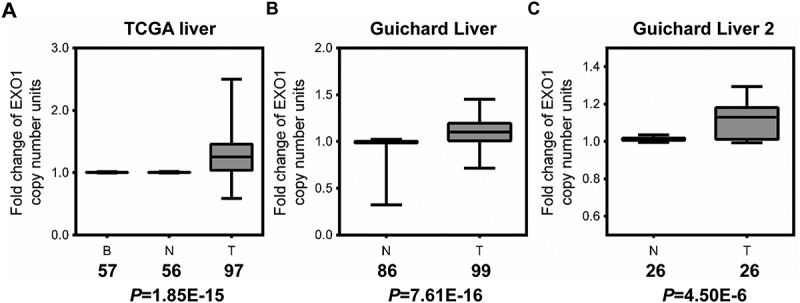
Figure 1.

EXO1 gene copy number is increased in HCC as assessed by data-mining of the Oncomine database. Box-whiskers Plot of EXO1 gene copy number between normal and cancer tissue samples in (a) TCGA Liver, (b) Guichard Liver, and (c) Guichard Liver 2 data sets. B, blood; N, normal liver; T, HCC. Numbers below the horizontal axis indicate total cases in different groups. The line within each box represents the median value; lower and upper edges of each box represent the 25th and 75th percentiles, respectively; lower and upper whiskers represent 5th and 95th percentiles, respectively. P values were calculated by the Oncomine database.
